Hospitality Management at University of Nevada-Las Vegas
If you are interested in studying Hospitality Management, take a look at what University of Nevada-Las Vegas. Get started with the following essential facts.
University of Nevada-Las Vegas is located in Las Vegas, NV.
For the most recent IPEDS reporting year, 455 hospitality management degrees were awarded at University of Nevada-Las Vegas.
Featured schools near , edit
Studying Online at University of Nevada-Las Vegas
Many students take online classes at University of Nevada-Las Vegas. Among 32,911 students, 3,840 (12%) studied exclusively online and 16,321 (50%) took at least some classes online.
Hospitality Management Rankings at University of Nevada-Las Vegas
These rankings give you a sense of how University of Nevada-Las Vegas’s Hospitality Management program to other colleges that offer this major.
Bachelor’s-Level Rankings
| Ranking | Scope | Rank |
|---|---|---|
| Best Schools (Quality) | Nevada | #1 of 2 |
| Best Value | Nevada | #2 of 2 |
| Best Value | Far Western (Region) | #11 of 24 |
| Best Schools (Quality) | Far Western (Region) | #14 of 24 |
| Best Value | Nationwide | #60 of 209 |
| Best Schools (Quality) | Nationwide | #73 of 210 |
Master’s-Level Rankings
| Ranking | Scope | Rank |
|---|---|---|
| Best Schools (Quality) | Nevada | #1 of 2 |
| Best Value | Nevada | #2 of 2 |
| Best Value | Far Western (Region) | #11 of 24 |
| Best Schools (Quality) | Far Western (Region) | #14 of 24 |
| Best Value | Nationwide | #60 of 209 |
| Best Schools (Quality) | Nationwide | #73 of 210 |
Doctoral-Level Rankings
| Ranking | Scope | Rank |
|---|---|---|
| Best Schools (Quality) | Nevada | #1 of 2 |
| Best Value | Nevada | #2 of 2 |
| Best Value | Far Western (Region) | #11 of 24 |
| Best Schools (Quality) | Far Western (Region) | #14 of 24 |
| Best Value | Nationwide | #60 of 209 |
| Best Schools (Quality) | Nationwide | #73 of 210 |
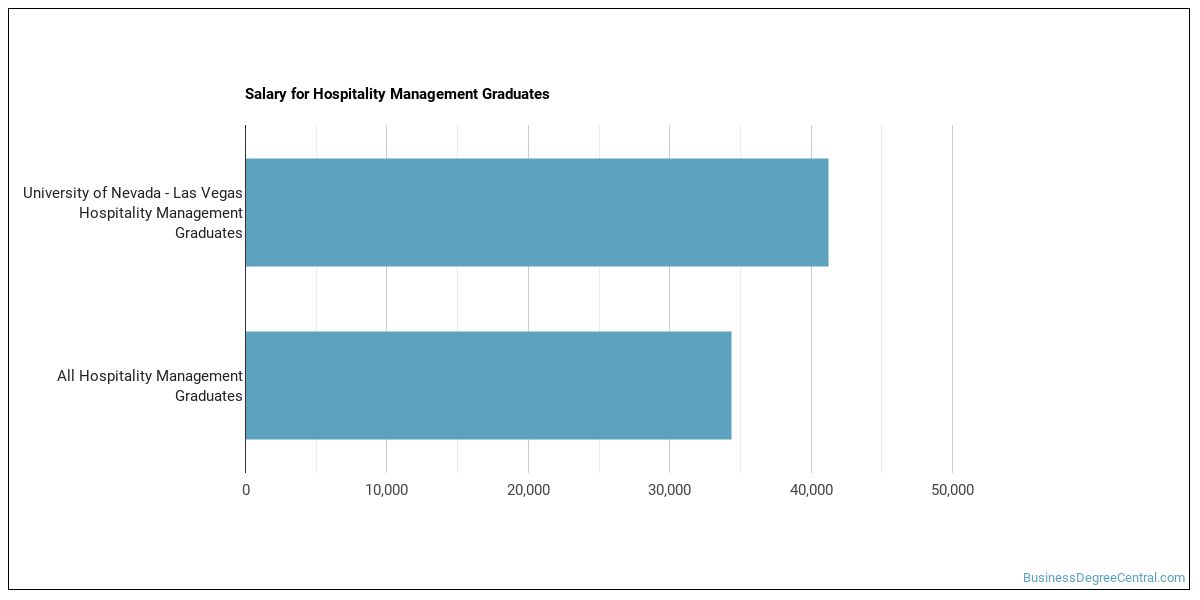
Earnings for Hospitality Management Graduates from University of Nevada-Las Vegas
Those who finish University of Nevada-Las Vegas’s Hospitality Management program report the following median earnings (per the U.S. Department of Education’s College Scorecard):
| Years After Graduation | Median Earnings |
|---|---|
| 1 year | $44,625 |
| 2 years | $46,455 |
| 3 years | $49,984 |
| 4 years | $51,399 |
| 5 years | $54,347 |
How does this compare to the school overall? Four years out, Hospitality Management graduates from University of Nevada-Las Vegas report median earnings of $51,399, compared with $60,972 for all University of Nevada-Las Vegas graduates — about 16% lower than the school-wide median.

Median Debt at Graduation
The median debt for Hospitality Management graduates from University of Nevada-Las Vegas comes in at $19,003.
Student Demographics & Diversity
The following sections describe the diversity of Hospitality Management graduates at University of Nevada-Las Vegas, broken down by degree level.
Looking at the program as a whole, Hospitality Management graduates at University of Nevada-Las Vegas are 54% women (246) and 46% men (209).
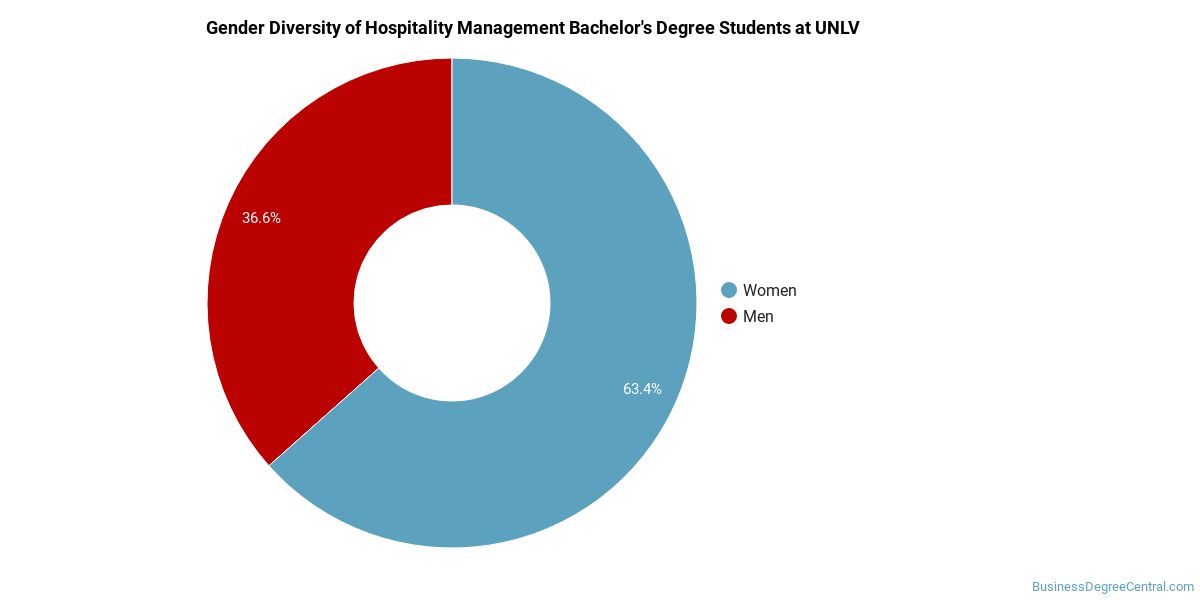
Hospitality Management Bachelor’s Program at University of Nevada-Las Vegas
Among the 389 bachelor’s hospitality management degrees awarded at University of Nevada-Las Vegas, 54% were women (212) and 46% were men (177).
The following table and chart show the race/ethnicity of Hospitality Management bachelor’s degree recipients at University of Nevada-Las Vegas.
| Race / Ethnicity | Number of Graduates |
|---|---|
| White | 104 |
| Hispanic / Latino | 84 |
| Black / African American | 15 |
| Asian | 76 |
| Native Hawaiian / Pacific Islander | 4 |
| Two or More Races | 36 |
| International (Nonresident) | 69 |
| Unknown | 1 |
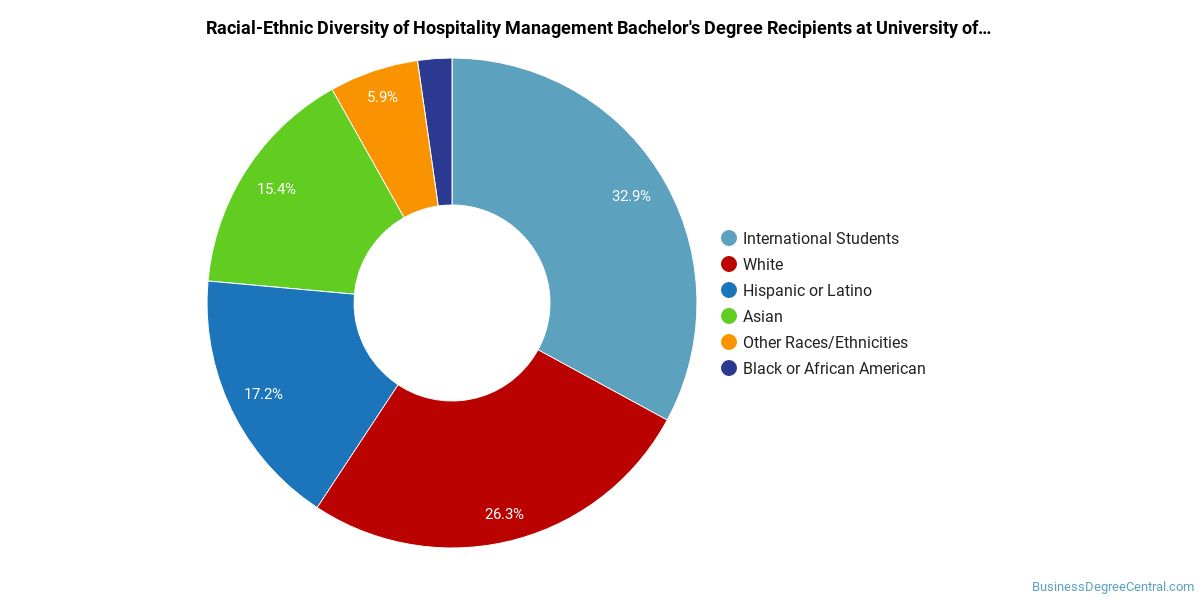
Minority students account for 55% of Hospitality Management bachelor’s degree recipients at University of Nevada-Las Vegas, higher than the national average of 34%.*
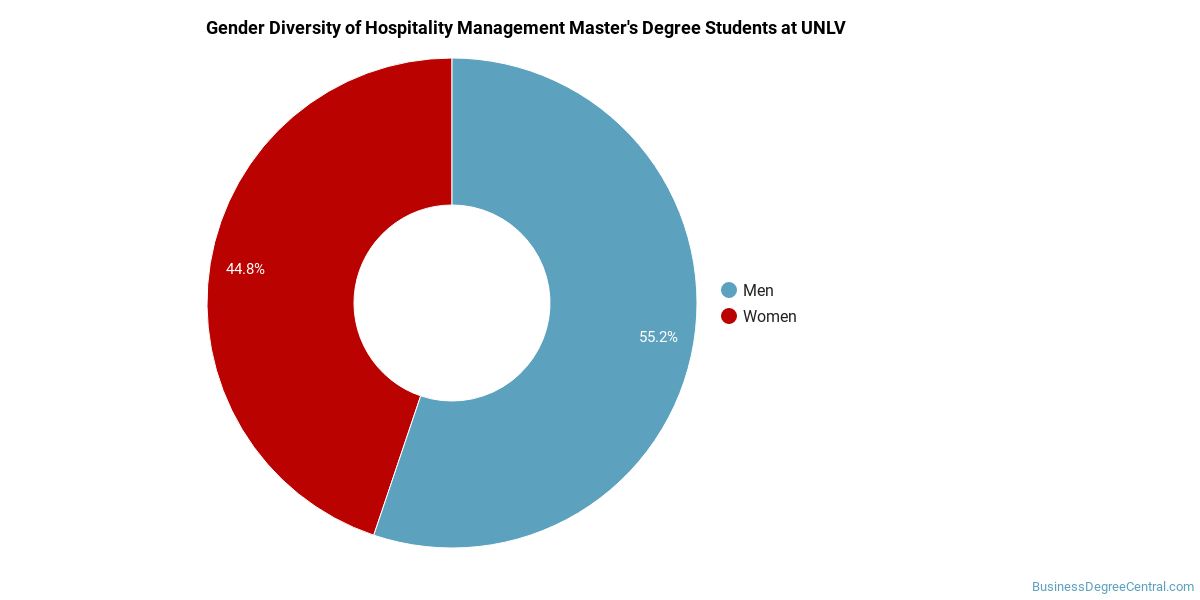
Hospitality Management Master’s Program at University of Nevada-Las Vegas
Among the 62 master’s hospitality management graduates at University of Nevada-Las Vegas, 53% were women (33) and 47% were men (29).
The following table and chart show the race/ethnicity of Hospitality Management master’s degree recipients at University of Nevada-Las Vegas.
| Race / Ethnicity | Number of Graduates |
|---|---|
| White | 16 |
| Hispanic / Latino | 6 |
| Black / African American | 3 |
| Asian | 8 |
| American Indian / Alaska Native | 1 |
| Two or More Races | 1 |
| International (Nonresident) | 26 |
| Unknown | 1 |
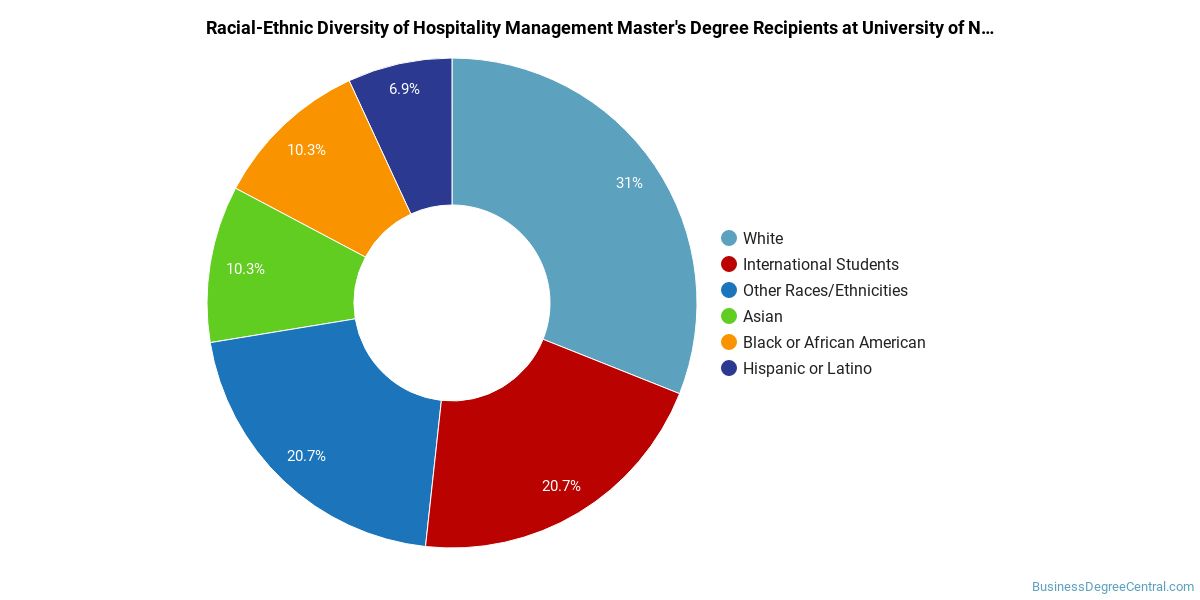
Racial-ethnic minorities make up 31% of Hospitality Management master’s degree recipients at University of Nevada-Las Vegas, below the national average of 31%.*
Hospitality Management Doctoral Program at University of Nevada-Las Vegas
Of the 2 doctoral hospitality management graduates at University of Nevada-Las Vegas, 50% were women (1) and 50% were men (1).

The following table and chart show the race/ethnicity of Hospitality Management doctoral degree recipients at University of Nevada-Las Vegas.
| Race / Ethnicity | Number of Graduates |
|---|---|
| Two or More Races | 1 |
| International (Nonresident) | 1 |

Minority students account for 50% of Hospitality Management doctoral degree recipients at University of Nevada-Las Vegas, above the national average of 15%.*
*The racial-ethnic minorities figure is the total number of graduates minus White, international (nonresident), and unknown-race graduates.
More Specific Hospitality Management Concentrations at University of Nevada-Las Vegas
The Hospitality Management program at University of Nevada-Las Vegas breaks down into more specific concentrations:
| Concentration | Graduates |
|---|---|
| General Hospitality Management | 453 |
| Casino Management | 2 |
Top-Paying Careers for Hospitality Management Graduates
Graduates of the Hospitality Management program at University of Nevada-Las Vegas pursue many career paths. Here are the highest-paying careers for Hospitality Management majors, ordered by median annual salary:
| Occupation | Nationwide Median Wage |
|---|---|
| Entertainment and Recreation Managers, Except Gambling | $170,172 |
| Wind Energy Development Managers | $169,952 |
| Food Service Managers | $165,782 |
| Loss Prevention Managers | $165,723 |
| Facilities Managers | $157,669 |
| Gambling Managers | $140,375 |
| Security Management Specialists | $128,654 |
| Wind Energy Operations Managers | $122,567 |
| Compliance Managers | $117,178 |
| Business Operations Specialists, All Other | $113,637 |
References
- IPEDS — Integrated Postsecondary Education Data System
- U.S. Department of Education — College Scorecard
- O*NET Online (Bureau of Labor Statistics)
- National Center for Education Statistics
More about our data sources and methodologies.
BusinessDegreeCentral.com provides higher-education, college and university, degree, program, career, salary, and other helpful information to students, faculty, institutions, and other internet audiences. Presented information and data are subject to change. Inclusion on this website does not imply or represent a direct relationship with the company, school, or brand. Information, though believed correct at time of publication, may not be correct, and no warranty is provided. Contact the schools to verify any information before relying on it. Financial aid may be available for those who qualify. The displayed options may include sponsored or recommended results, not necessarily based on your preferences.
© BusinessDegreeCentral.com – All Rights Reserved.