Business & Commerce at Community College of Baltimore County
If you plan to study Business & Commerce, consider the program at Community College of Baltimore County. We’ve gathered the following information to help you decide.
Community College of Baltimore County is in Baltimore, MD.
In the most recent year for which we have data, 73 business & commerce degrees were granted at Community College of Baltimore County.
Featured schools near , edit
Studying Online at Community College of Baltimore County
Distance learning is available at Community College of Baltimore County. Of 16,451 students, 5,157 (31%) were enrolled entirely in distance education and 4,598 (28%) took at least some classes online.
Business & Commerce Rankings at Community College of Baltimore County
Rankings can help you compare Community College of Baltimore County’s Business & Commerce program to other colleges that offer this major.
Associate-Level Rankings
| Ranking | Scope | Rank |
|---|---|---|
| Best Value | Maryland | #3 of 19 |
| Best Value | Middle Atlantic (Region) | #8 of 80 |
| Best Schools (Quality) | Maryland | #12 of 18 |
| Best Schools (Quality) | Middle Atlantic (Region) | #44 of 84 |
| Best Value | Nationwide | #65 of 561 |
| Best Schools (Quality) | Nationwide | #183 of 567 |
Earnings for Business & Commerce Graduates from Community College of Baltimore County
Those who finish Community College of Baltimore County’s Business & Commerce program report the following median earnings (per the U.S. Department of Education’s College Scorecard):

| Years After Graduation | Median Earnings |
|---|---|
| 1 year | $34,123 |
| 2 years | $25,194 |
| 3 years | $37,645 |
| 4 years | $44,670 |
| 5 years | $56,799 |
How do these earnings stack up against the rest of the school? At the four-year mark, Business & Commerce graduates from Community College of Baltimore County report median earnings of $44,670, compared with $53,834 for all Community College of Baltimore County graduates — about 17% lower than the school-wide median.

Median Debt at Graduation
The median debt for Business & Commerce graduates from Community College of Baltimore County comes in at $17,499.
Student Demographics & Diversity
Below you’ll find the student demographics for Business & Commerce graduates at Community College of Baltimore County, broken down by degree level.
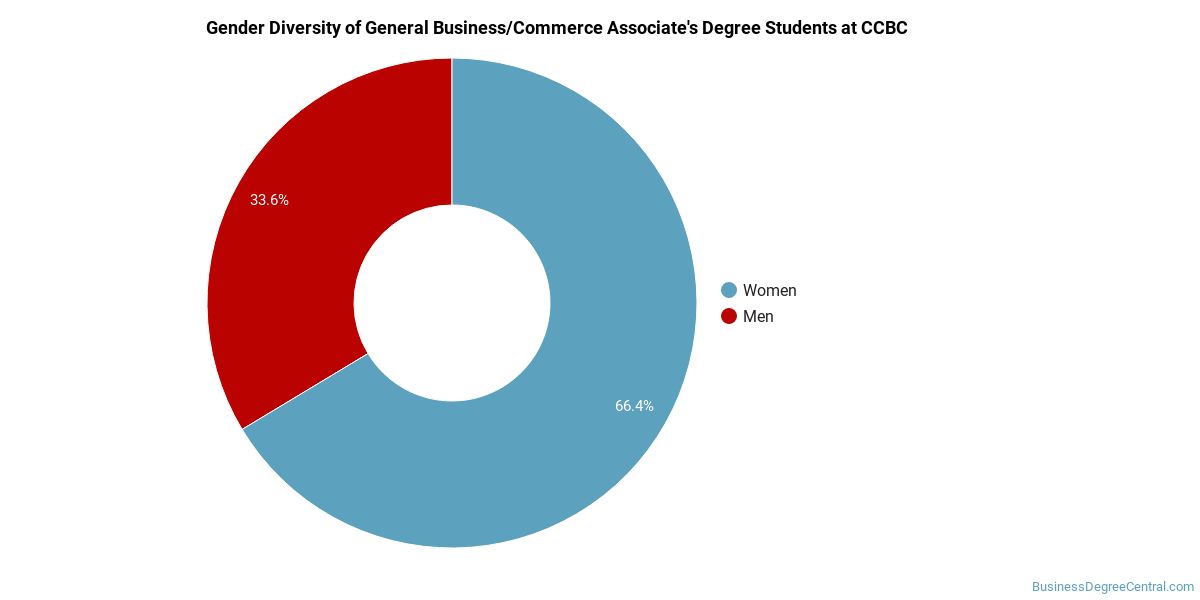
Program-wide, Business & Commerce graduates at Community College of Baltimore County are 52% women (38) and 48% men (35).
Business & Commerce Associate’s Program at Community College of Baltimore County
Of the 73 associate’s business & commerce graduates at Community College of Baltimore County, 52% were women (38) and 48% were men (35).
The following table and chart show the race/ethnicity of Business & Commerce associate’s degree recipients at Community College of Baltimore County.
| Race / Ethnicity | Number of Graduates |
|---|---|
| White | 28 |
| Hispanic / Latino | 15 |
| Black / African American | 16 |
| Asian | 5 |
| Two or More Races | 1 |
| International (Nonresident) | 7 |
| Unknown | 1 |
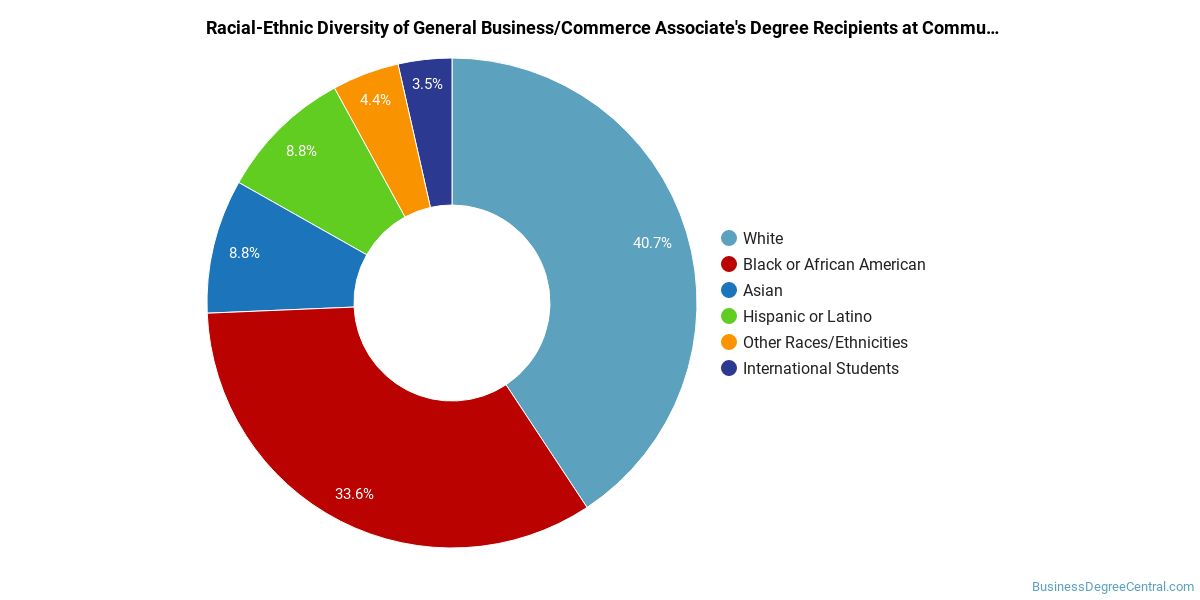
Racial-ethnic minorities make up 51% of Business & Commerce associate’s degree recipients at Community College of Baltimore County, above the national average of 50%.*
*The racial-ethnic minorities figure is the total number of graduates minus White, international (nonresident), and unknown-race graduates.
More Specific Business & Commerce Concentrations at Community College of Baltimore County
This Business & Commerce program at Community College of Baltimore County includes the following sub-specializations:
| Concentration | Graduates |
|---|---|
| General Business & Commerce | 73 |
Highest-Paying Careers for Business & Commerce Graduates
Those who complete Business & Commerce program at Community College of Baltimore County work across a variety of fields. The table below ranks the top-paying careers for Business & Commerce majors, ordered by median annual salary:
| Occupation | Nationwide Median Wage |
|---|---|
| Entertainment and Recreation Managers, Except Gambling | $170,172 |
| Loss Prevention Managers | $165,723 |
| Biofuels Production Managers | $164,096 |
| Geothermal Production Managers | $160,381 |
| Administrative Services Managers | $158,084 |
| Facilities Managers | $157,669 |
| Social and Community Service Managers | $156,089 |
| General and Operations Managers | $149,694 |
| Biomass Power Plant Managers | $146,025 |
| Chief Executives | $138,534 |
References
- IPEDS — Integrated Postsecondary Education Data System
- U.S. Department of Education — College Scorecard
- O*NET Online (Bureau of Labor Statistics)
- National Center for Education Statistics
More about our data sources and methodologies.
BusinessDegreeCentral.com provides higher-education, college and university, degree, program, career, salary, and other helpful information to students, faculty, institutions, and other internet audiences. Presented information and data are subject to change. Inclusion on this website does not imply or represent a direct relationship with the company, school, or brand. Information, though believed correct at time of publication, may not be correct, and no warranty is provided. Contact the schools to verify any information before relying on it. Financial aid may be available for those who qualify. The displayed options may include sponsored or recommended results, not necessarily based on your preferences.
© BusinessDegreeCentral.com – All Rights Reserved.