Business & Commerce at Tabor College
If you are interested in studying Business & Commerce, consider the program at Tabor College. The following information will help you decide if it is a good fit for you.
Tabor College is in Hillsboro, KS.
During the most recent reporting year, 14 business & commerce graduations were recorded at Tabor College.
Featured schools near , edit
Online Class Availability at Tabor College
Many students take online classes at Tabor College. Among 621 students, 57 (9%) were enrolled entirely in distance education and 0 (0%) took at least some classes online.
Student Demographics & Diversity
Below you’ll find the diversity of Business & Commerce graduates at Tabor College, broken down by degree level.
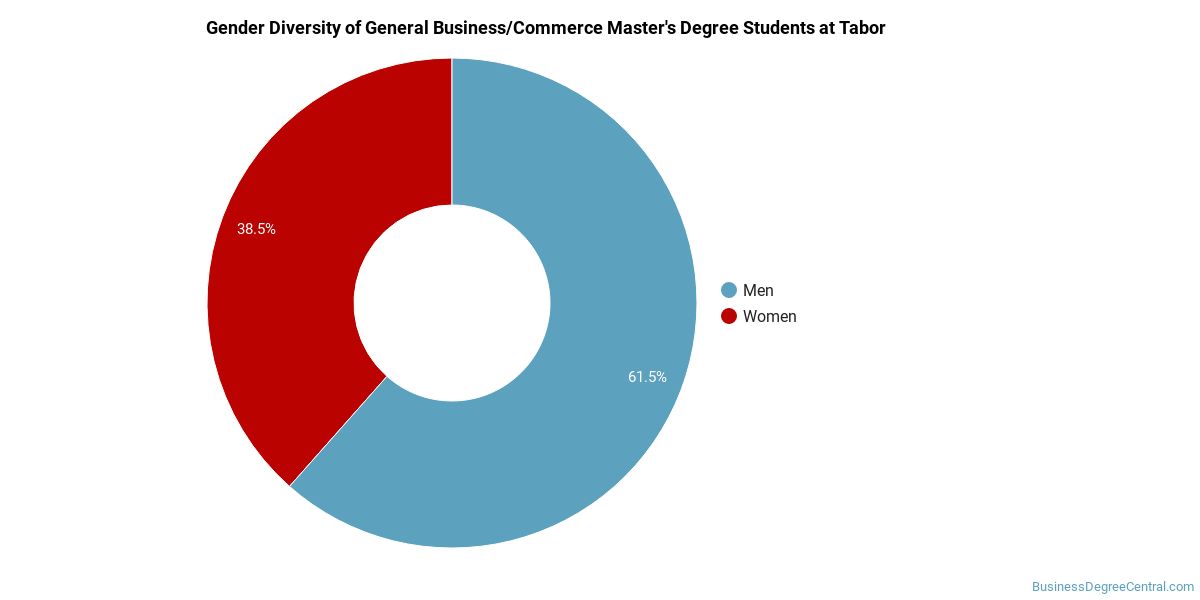
Across all degree levels, Business & Commerce graduates at Tabor College are 29% women (4) and 71% men (10).
Business & Commerce Master’s Program at Tabor College
Among the 14 master’s business & commerce graduates at Tabor College, 29% were women (4) and 71% were men (10).
The following table and chart show the race/ethnicity of Business & Commerce master’s degree recipients at Tabor College.
| Race / Ethnicity | Number of Graduates |
|---|---|
| White | 9 |
| Hispanic / Latino | 2 |
| Black / African American | 1 |
| Two or More Races | 1 |
| International (Nonresident) | 1 |
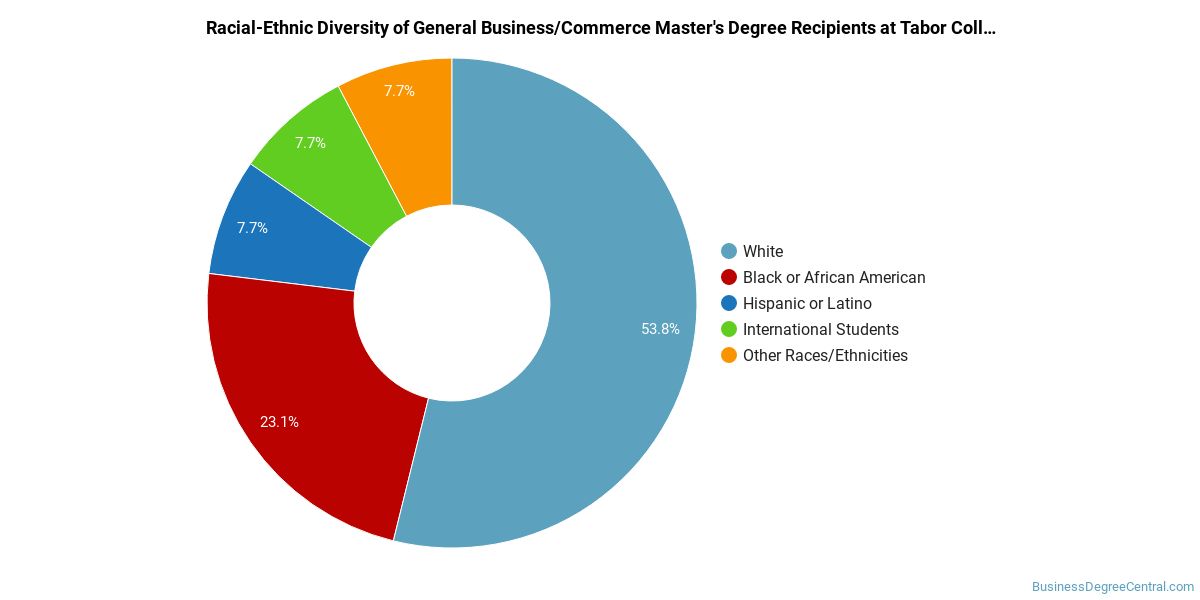
Minority students account for 29% of Business & Commerce master’s degree recipients at Tabor College, above the national average of 28%.*
*The racial-ethnic minorities figure is the total number of graduates minus White, international (nonresident), and unknown-race graduates.
More Specific Business & Commerce Concentrations at Tabor College
The Business & Commerce program at Tabor College breaks down into more specific concentrations:
| Concentration | Graduates |
|---|---|
| General Business & Commerce | 14 |
Best-Paid Careers for Business & Commerce Graduates
Graduates of the Business & Commerce program at Tabor College go on to a range of careers. Here are the highest-paying careers for Business & Commerce graduates, ordered by median annual salary:
| Occupation | Nationwide Median Wage |
|---|---|
| Entertainment and Recreation Managers, Except Gambling | $170,172 |
| Loss Prevention Managers | $165,723 |
| Biofuels Production Managers | $164,096 |
| Geothermal Production Managers | $160,381 |
| Administrative Services Managers | $158,084 |
| Facilities Managers | $157,669 |
| Social and Community Service Managers | $156,089 |
| General and Operations Managers | $149,694 |
| Biomass Power Plant Managers | $146,025 |
| Chief Executives | $138,534 |
References
- IPEDS — Integrated Postsecondary Education Data System
- U.S. Department of Education — College Scorecard
- O*NET Online (Bureau of Labor Statistics)
- National Center for Education Statistics
More about our data sources and methodologies.
BusinessDegreeCentral.com provides higher-education, college and university, degree, program, career, salary, and other helpful information to students, faculty, institutions, and other internet audiences. Presented information and data are subject to change. Inclusion on this website does not imply or represent a direct relationship with the company, school, or brand. Information, though believed correct at time of publication, may not be correct, and no warranty is provided. Contact the schools to verify any information before relying on it. Financial aid may be available for those who qualify. The displayed options may include sponsored or recommended results, not necessarily based on your preferences.
© BusinessDegreeCentral.com – All Rights Reserved.