Business & Commerce at Niagara University
If you are interested in studying Business & Commerce, take a look at what Niagara University. Get started with the following essential facts.
Niagara University sits in Niagara University, NY.
During the most recent reporting year, 62 business & commerce graduations were recorded at Niagara University.
Featured schools near , edit
Online Class Availability at Niagara University
Distance learning is available at Niagara University. Of 4,033 students, 841 (21%) were enrolled entirely in distance education and 1,634 (41%) took at least some classes online.
Business & Commerce Rankings at Niagara University
These rankings give you a sense of how Niagara University’s Business & Commerce program against other schools offering the same major.
Master’s-Level Rankings
| Ranking | Scope | Rank |
|---|---|---|
| Best Schools (Quality) | New York | #8 of 21 |
| Best Value | New York | #12 of 19 |
| Best Schools (Quality) | Middle Atlantic (Region) | #39 of 84 |
| Best Value | Middle Atlantic (Region) | #48 of 80 |
| Best Schools (Quality) | Nationwide | #162 of 567 |
| Best Value | Nationwide | #398 of 561 |
Earnings for Business & Commerce Graduates from Niagara University
Those who finish Niagara University’s Business & Commerce program earn the following amounts (per the U.S. Department of Education’s College Scorecard):

| Years After Graduation | Median Earnings |
|---|---|
| 1 year | $53,180 |
| 2 years | $54,644 |
| 3 years | $60,793 |
| 4 years | $89,813 |
| 5 years | $99,537 |
How does this compare to the school overall? At the four-year mark, Business & Commerce graduates from Niagara University take home a median $89,813, compared with $50,690 for all Niagara University graduates — about 77% higher than the school-wide median.

Student Demographics & Diversity
The following sections describe the student demographics for Business & Commerce graduates at Niagara University, broken down by degree level.
Program-wide, Business & Commerce graduates at Niagara University are 58% women (36) and 42% men (26).
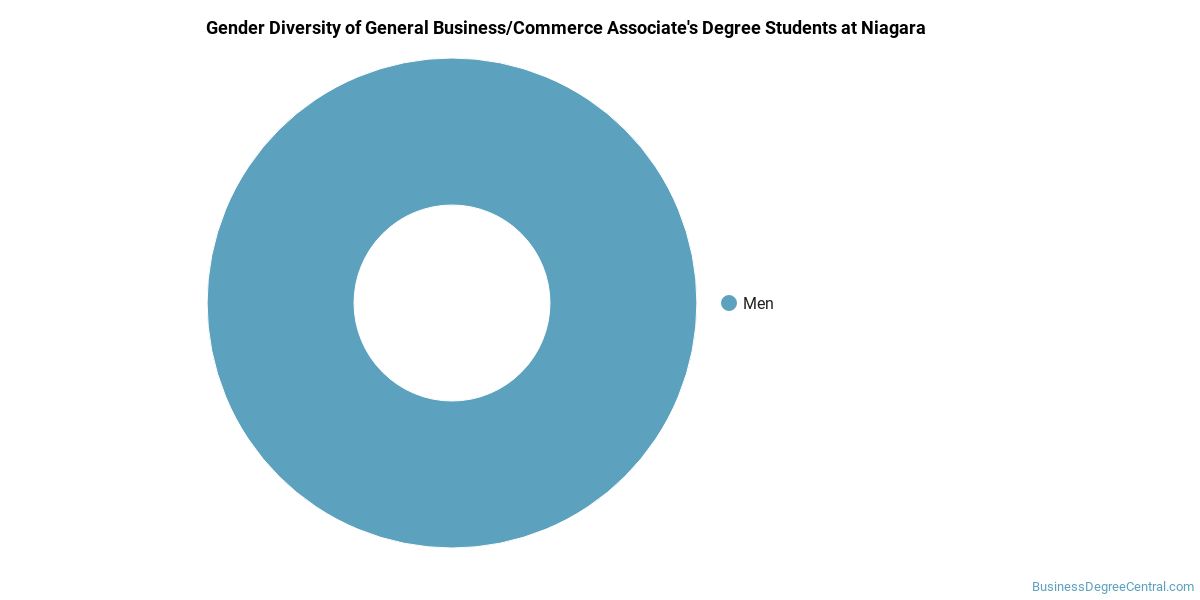
Business & Commerce Associate’s Program at Niagara University
Of the 2 associate’s business & commerce graduates at Niagara University, 50% were women (1) and 50% were men (1).
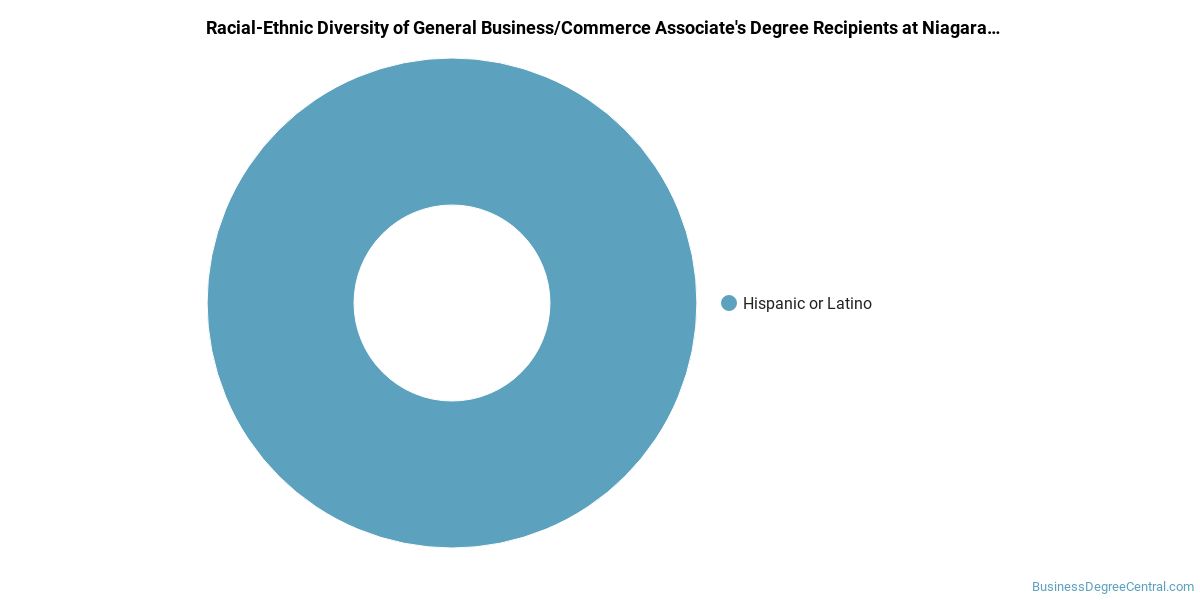
The following table and chart show the race/ethnicity of Business & Commerce associate’s degree recipients at Niagara University.
| Race / Ethnicity | Number of Graduates |
|---|---|
| White | 2 |
Business & Commerce Bachelor’s Program at Niagara University
Among the 2 bachelor’s business & commerce degrees awarded at Niagara University, 0% were women (0) and 100% were men (2).

The following table and chart show the race/ethnicity of Business & Commerce bachelor’s degree recipients at Niagara University.
| Race / Ethnicity | Number of Graduates |
|---|---|
| White | 1 |
| Black / African American | 1 |

Racial-ethnic minorities make up 50% of Business & Commerce bachelor’s degree recipients at Niagara University, higher than the national average of 37%.*
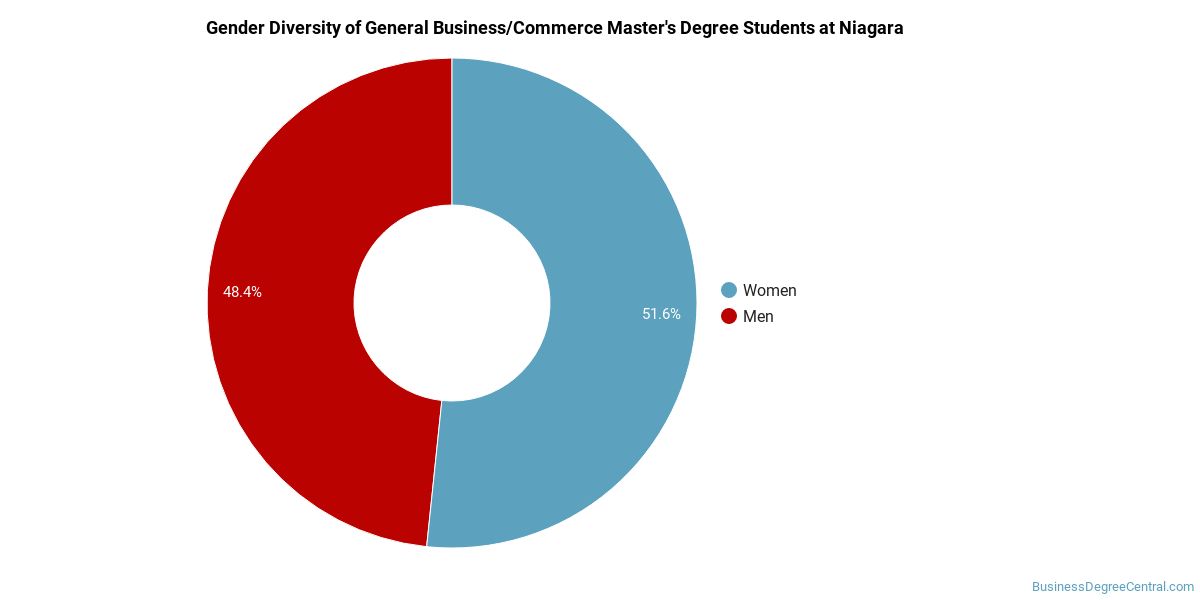
Business & Commerce Master’s Program at Niagara University
Among the 58 master’s business & commerce graduates at Niagara University, 60% were women (35) and 40% were men (23).
The following table and chart show the race/ethnicity of Business & Commerce master’s degree recipients at Niagara University.
| Race / Ethnicity | Number of Graduates |
|---|---|
| White | 19 |
| Hispanic / Latino | 2 |
| Black / African American | 7 |
| International (Nonresident) | 30 |
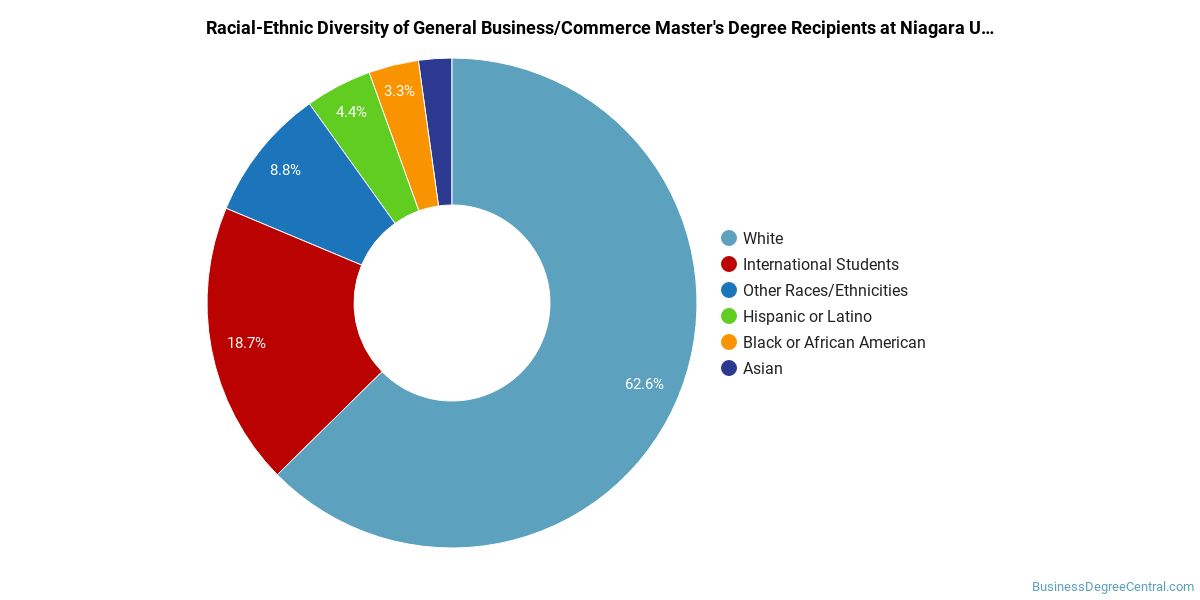
Racial-ethnic minorities make up 16% of Business & Commerce master’s degree recipients at Niagara University, lower than the national average of 28%.*
*The racial-ethnic minorities figure is the total number of graduates minus White, international (nonresident), and unknown-race graduates.
More Specific Business & Commerce Concentrations at Niagara University
This Business & Commerce program at Niagara University includes the following sub-specializations:
| Concentration | Graduates |
|---|---|
| General Business & Commerce | 62 |
Highest-Paying Careers for Business & Commerce Graduates
Graduates of the Business & Commerce program at Niagara University pursue many career paths. Here are the highest-paying careers for Business & Commerce graduates, ordered by median annual salary:
| Occupation | Nationwide Median Wage |
|---|---|
| Entertainment and Recreation Managers, Except Gambling | $170,172 |
| Loss Prevention Managers | $165,723 |
| Biofuels Production Managers | $164,096 |
| Geothermal Production Managers | $160,381 |
| Administrative Services Managers | $158,084 |
| Facilities Managers | $157,669 |
| Social and Community Service Managers | $156,089 |
| General and Operations Managers | $149,694 |
| Biomass Power Plant Managers | $146,025 |
| Chief Executives | $138,534 |
References
- IPEDS — Integrated Postsecondary Education Data System
- U.S. Department of Education — College Scorecard
- O*NET Online (Bureau of Labor Statistics)
- National Center for Education Statistics
More about our data sources and methodologies.
BusinessDegreeCentral.com provides higher-education, college and university, degree, program, career, salary, and other helpful information to students, faculty, institutions, and other internet audiences. Presented information and data are subject to change. Inclusion on this website does not imply or represent a direct relationship with the company, school, or brand. Information, though believed correct at time of publication, may not be correct, and no warranty is provided. Contact the schools to verify any information before relying on it. Financial aid may be available for those who qualify. The displayed options may include sponsored or recommended results, not necessarily based on your preferences.
© BusinessDegreeCentral.com – All Rights Reserved.