Business & Commerce at Lindenwood University
What traits are you looking for in a school for Business & Commerce, take a look at what Lindenwood University. The following information will help you decide if it is a good fit for you.
Lindenwood University is in Saint Charles, MO.
For the most recent IPEDS reporting year, 276 business & commerce degrees were granted at Lindenwood University.
Featured schools near , edit
Online Class Availability at Lindenwood University
Online coursework is an option at Lindenwood University. Among 6,826 students, 3,177 (47%) studied exclusively online and 2,994 (44%) took at least some classes online.
Business & Commerce Rankings at Lindenwood University
These rankings give you a sense of how Lindenwood University’s Business & Commerce program against other schools offering the same major.
Bachelor’s-Level Rankings
| Ranking | Scope | Rank |
|---|---|---|
| Best Schools (Quality) | Missouri | #8 of 17 |
| Best Value | Missouri | #13 of 17 |
| Best Schools (Quality) | The Plains States (Region) | #37 of 54 |
| Best Value | The Plains States (Region) | #39 of 54 |
| Best Schools (Quality) | Nationwide | #313 of 567 |
| Best Value | Nationwide | #404 of 561 |
Master’s-Level Rankings
| Ranking | Scope | Rank |
|---|---|---|
| Best Schools (Quality) | Missouri | #8 of 17 |
| Best Value | Missouri | #13 of 17 |
| Best Schools (Quality) | The Plains States (Region) | #37 of 54 |
| Best Value | The Plains States (Region) | #39 of 54 |
| Best Schools (Quality) | Nationwide | #313 of 567 |
| Best Value | Nationwide | #404 of 561 |
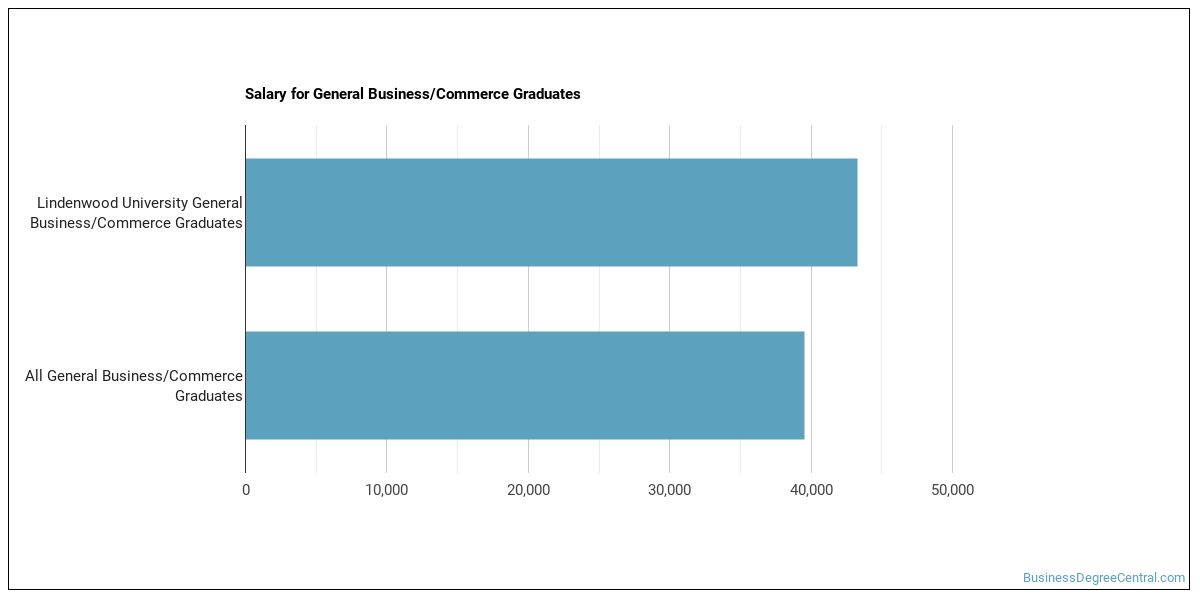
Earnings for Business & Commerce Graduates from Lindenwood University
Those who finish Lindenwood University’s Business & Commerce program report the following median earnings (per the U.S. Department of Education’s College Scorecard):
| Years After Graduation | Median Earnings |
|---|---|
| 1 year | $50,420 |
| 2 years | $50,806 |
| 3 years | $54,971 |
| 4 years | $62,267 |
| 5 years | $72,917 |
How does this compare to the school overall? Four years out, Business & Commerce graduates from Lindenwood University report median earnings of $62,267, compared with $51,541 for all Lindenwood University graduates — about 21% higher than the school-wide median.

Median Debt at Graduation
The median debt for Business & Commerce graduates from Lindenwood University stands at $31,000.
Student Demographics & Diversity
Take a look at the diversity of Business & Commerce graduates at Lindenwood University, by degree type.
Looking at the program as a whole, Business & Commerce graduates at Lindenwood University are 52% women (143) and 48% men (133).
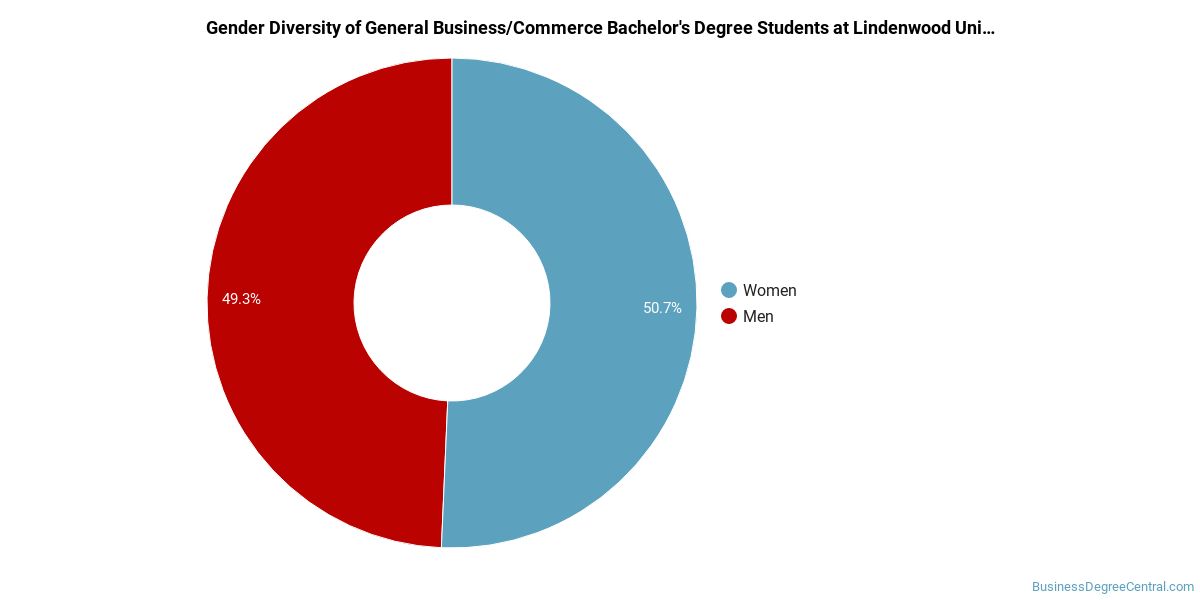
Business & Commerce Bachelor’s Program at Lindenwood University
Of the 155 bachelor’s business & commerce graduates at Lindenwood University, 51% were women (79) and 49% were men (76).
The following table and chart show the race/ethnicity of Business & Commerce bachelor’s degree recipients at Lindenwood University.
| Race / Ethnicity | Number of Graduates |
|---|---|
| White | 109 |
| Hispanic / Latino | 7 |
| Black / African American | 12 |
| Asian | 5 |
| Native Hawaiian / Pacific Islander | 1 |
| Two or More Races | 5 |
| International (Nonresident) | 11 |
| Unknown | 5 |
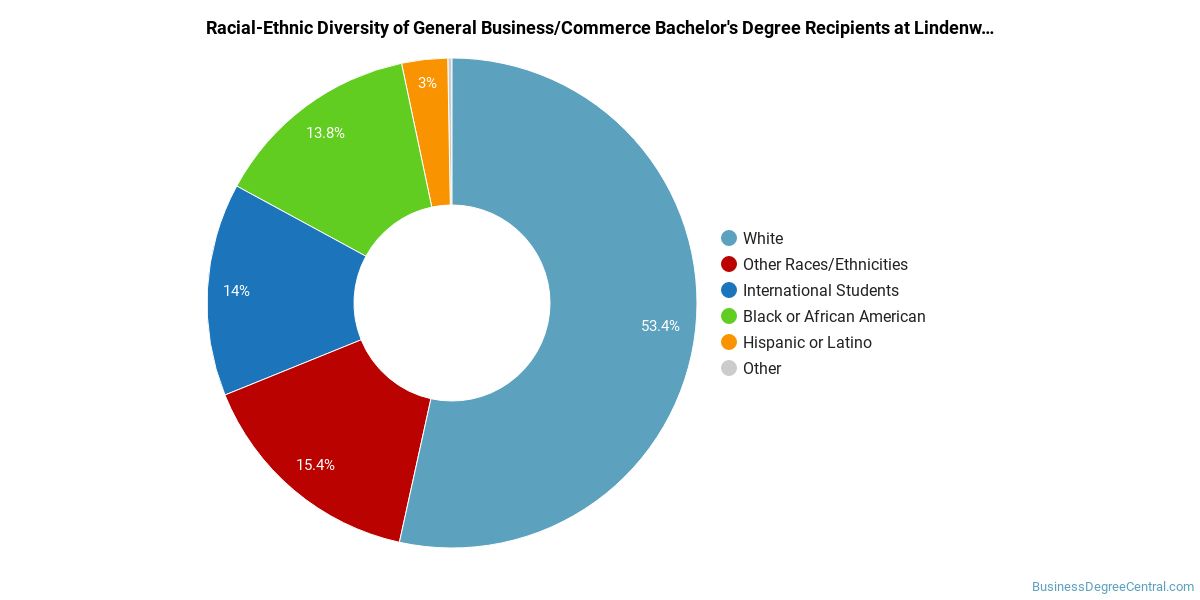
Racial-ethnic minorities make up 19% of Business & Commerce bachelor’s degree recipients at Lindenwood University, lower than the national average of 37%.*
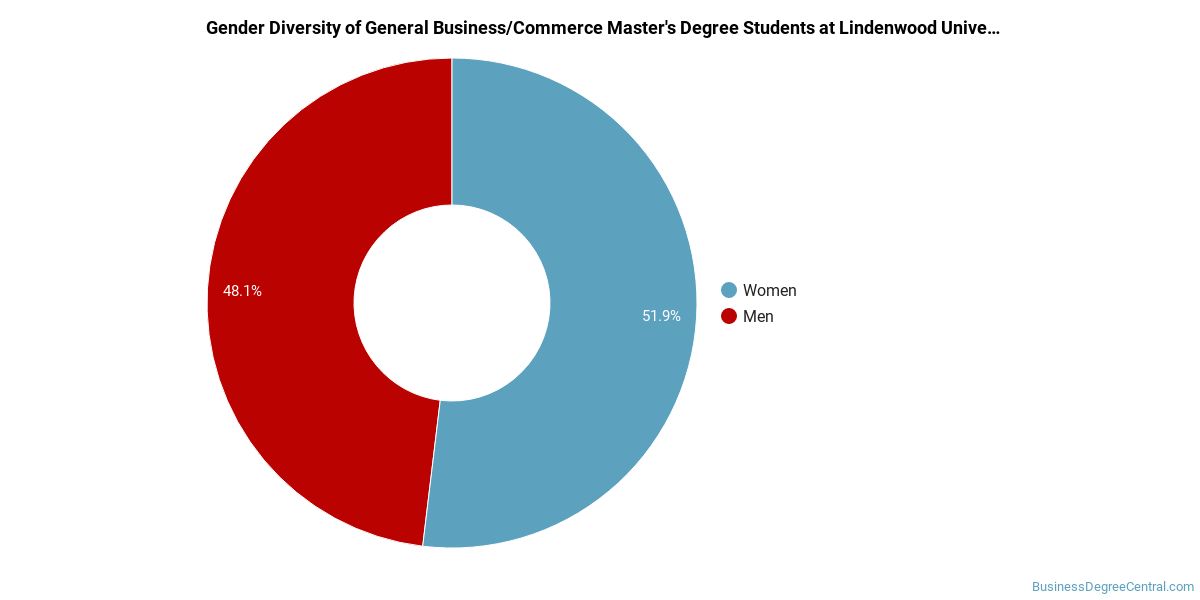
Business & Commerce Master’s Program at Lindenwood University
Of the 121 master’s business & commerce degrees awarded at Lindenwood University, 53% were women (64) and 47% were men (57).
The following table and chart show the race/ethnicity of Business & Commerce master’s degree recipients at Lindenwood University.
| Race / Ethnicity | Number of Graduates |
|---|---|
| White | 78 |
| Hispanic / Latino | 3 |
| Black / African American | 12 |
| Asian | 3 |
| Two or More Races | 3 |
| International (Nonresident) | 16 |
| Unknown | 6 |
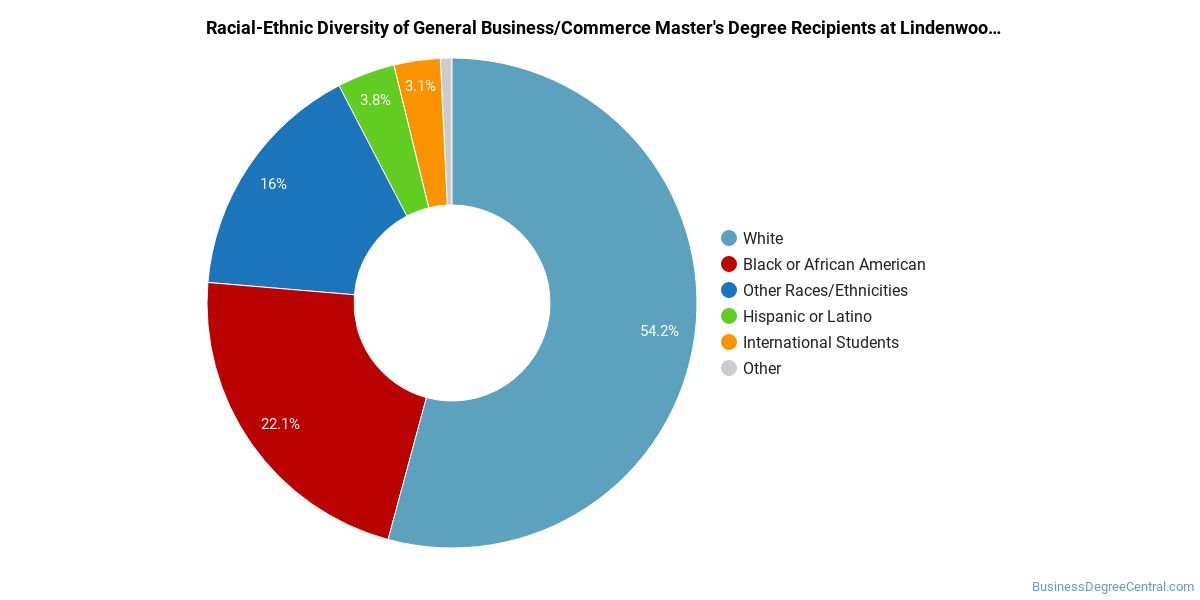
Racial-ethnic minorities make up 17% of Business & Commerce master’s degree recipients at Lindenwood University, lower than the national average of 28%.*
*The racial-ethnic minorities figure is the total number of graduates minus White, international (nonresident), and unknown-race graduates.
More Specific Business & Commerce Concentrations at Lindenwood University
This Business & Commerce program at Lindenwood University offers more specialized concentrations:
| Concentration | Graduates |
|---|---|
| General Business & Commerce | 276 |
Highest-Paying Careers for Business & Commerce Graduates
Students who finish Business & Commerce program at Lindenwood University work across a variety of fields. The table below ranks the top-paying careers for Business & Commerce majors, ordered by median annual salary:
| Occupation | Nationwide Median Wage |
|---|---|
| Entertainment and Recreation Managers, Except Gambling | $170,172 |
| Loss Prevention Managers | $165,723 |
| Biofuels Production Managers | $164,096 |
| Geothermal Production Managers | $160,381 |
| Administrative Services Managers | $158,084 |
| Facilities Managers | $157,669 |
| Social and Community Service Managers | $156,089 |
| General and Operations Managers | $149,694 |
| Biomass Power Plant Managers | $146,025 |
| Chief Executives | $138,534 |
References
- IPEDS — Integrated Postsecondary Education Data System
- U.S. Department of Education — College Scorecard
- O*NET Online (Bureau of Labor Statistics)
- National Center for Education Statistics
More about our data sources and methodologies.
BusinessDegreeCentral.com provides higher-education, college and university, degree, program, career, salary, and other helpful information to students, faculty, institutions, and other internet audiences. Presented information and data are subject to change. Inclusion on this website does not imply or represent a direct relationship with the company, school, or brand. Information, though believed correct at time of publication, may not be correct, and no warranty is provided. Contact the schools to verify any information before relying on it. Financial aid may be available for those who qualify. The displayed options may include sponsored or recommended results, not necessarily based on your preferences.
© BusinessDegreeCentral.com – All Rights Reserved.