Business & Commerce at Indiana University-Bloomington
What traits are you looking for in a school for Business & Commerce, you may want to check out the program at Indiana University-Bloomington. The following information will help you decide if it is a good fit for you.
Indiana University-Bloomington is in Bloomington, IN.
During the most recent reporting year, 3,530 business & commerce degrees were granted at Indiana University-Bloomington.
Featured schools near , edit
Studying Online at Indiana University-Bloomington
Many students take online classes at Indiana University-Bloomington. Among 48,424 students, 3,249 (7%) were enrolled entirely in distance education and 17,945 (37%) took at least some classes online.
Business & Commerce Rankings at Indiana University-Bloomington
These rankings give you a sense of how Indiana University-Bloomington’s Business & Commerce program to other colleges that offer this major.
Bachelor’s-Level Rankings
| Ranking | Scope | Rank |
|---|---|---|
| Best Schools (Quality) | Great Lakes (Region) | #1 of 83 |
| Best Schools (Quality) | Indiana | #1 of 20 |
| Best Schools (Quality) | Nationwide | #3 of 567 |
| Best Value | Indiana | #8 of 20 |
| Best Value | Great Lakes (Region) | #30 of 82 |
| Best Value | Nationwide | #279 of 561 |
Master’s-Level Rankings
| Ranking | Scope | Rank |
|---|---|---|
| Best Schools (Quality) | Great Lakes (Region) | #1 of 83 |
| Best Schools (Quality) | Indiana | #1 of 20 |
| Best Schools (Quality) | Nationwide | #3 of 567 |
| Best Value | Indiana | #8 of 20 |
| Best Value | Great Lakes (Region) | #30 of 82 |
| Best Value | Nationwide | #279 of 561 |
Doctoral-Level Rankings
| Ranking | Scope | Rank |
|---|---|---|
| Best Schools (Quality) | Great Lakes (Region) | #1 of 83 |
| Best Schools (Quality) | Indiana | #1 of 20 |
| Best Schools (Quality) | Nationwide | #3 of 567 |
| Best Value | Indiana | #8 of 20 |
| Best Value | Great Lakes (Region) | #30 of 82 |
| Best Value | Nationwide | #279 of 561 |
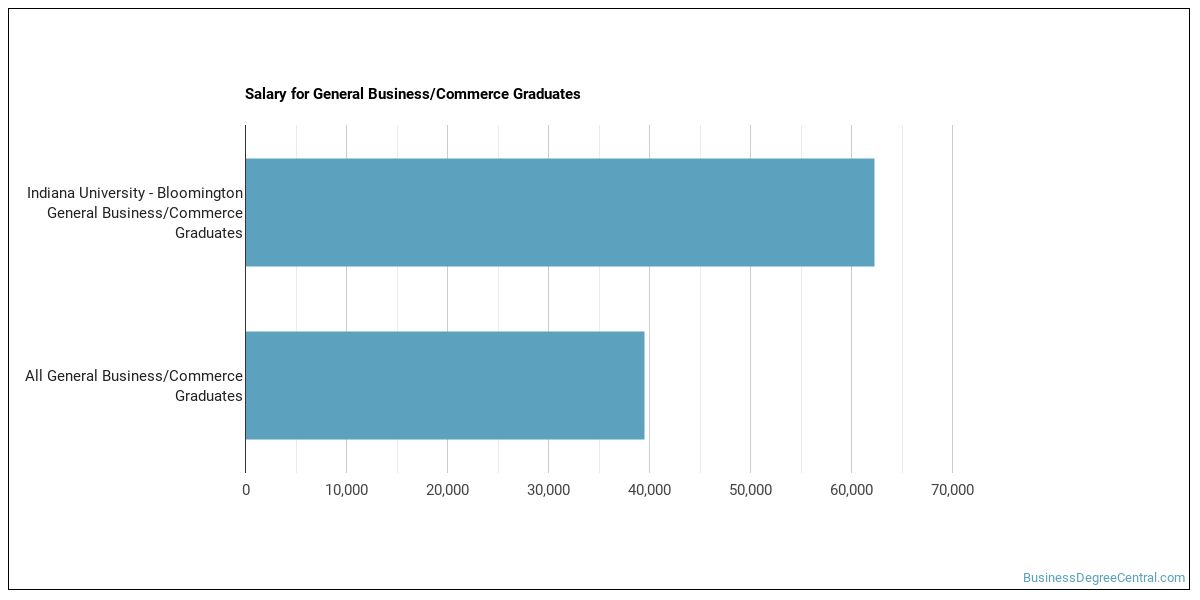
Earnings for Business & Commerce Graduates from Indiana University-Bloomington
Graduates of Indiana University-Bloomington’s Business & Commerce program earn at the following median levels (per the U.S. Department of Education’s College Scorecard):
| Years After Graduation | Median Earnings |
|---|---|
| 1 year | $77,783 |
| 2 years | $80,337 |
| 3 years | $91,800 |
| 4 years | $104,524 |
| 5 years | $124,509 |
Is this above or below average for the school? Four years after graduating, Business & Commerce graduates from Indiana University-Bloomington earn a median of $104,524, compared with $74,553 for all Indiana University-Bloomington graduates — about 40% higher than the school-wide median.

Median Debt at Graduation
The median debt for Business & Commerce graduates from Indiana University-Bloomington comes in at $19,500.
Student Demographics & Diversity
The following sections describe the student demographics for Business & Commerce graduates at Indiana University-Bloomington, by degree type.
Across all degree levels, Business & Commerce graduates at Indiana University-Bloomington are 32% women (1,144) and 68% men (2,386).
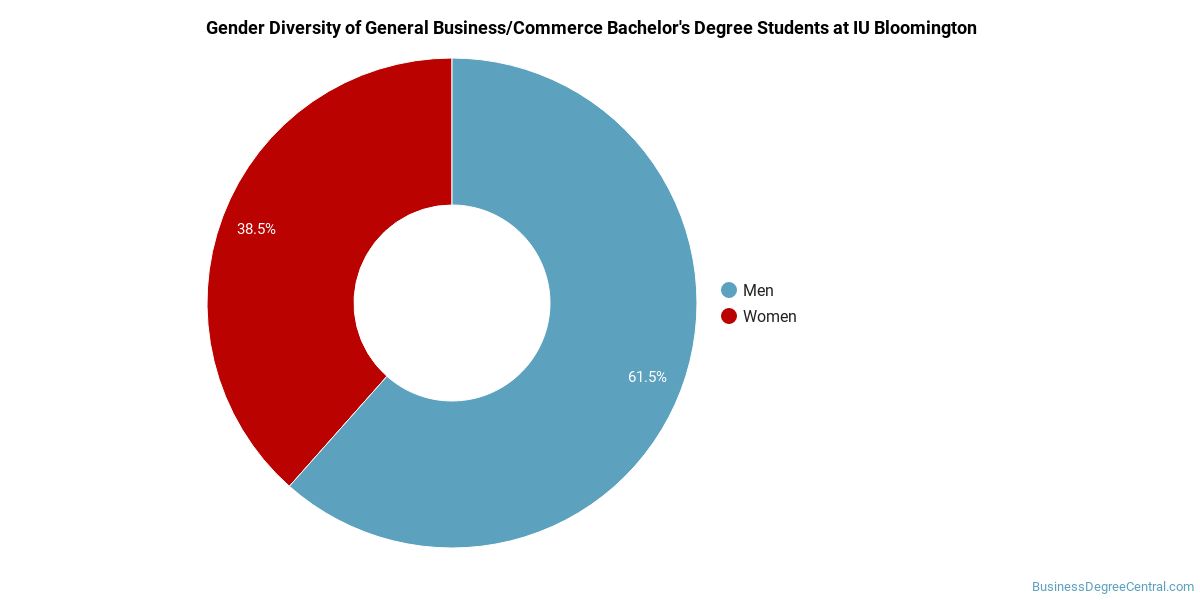
Business & Commerce Bachelor’s Program at Indiana University-Bloomington
Of the 2,407 bachelor’s business & commerce graduates at Indiana University-Bloomington, 33% were women (800) and 67% were men (1,607).
The following table and chart show the race/ethnicity of Business & Commerce bachelor’s degree recipients at Indiana University-Bloomington.
| Race / Ethnicity | Number of Graduates |
|---|---|
| White | 1,562 |
| Hispanic / Latino | 149 |
| Black / African American | 30 |
| Asian | 383 |
| Two or More Races | 110 |
| International (Nonresident) | 158 |
| Unknown | 15 |
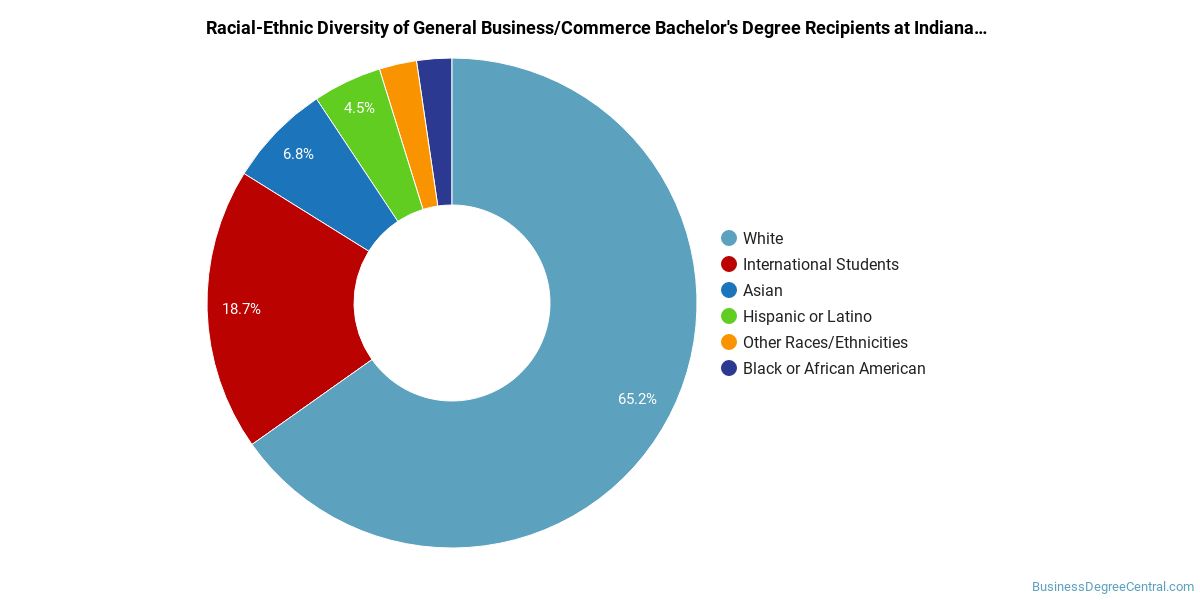
Racial-ethnic minorities make up 28% of Business & Commerce bachelor’s degree recipients at Indiana University-Bloomington, below the national average of 37%.*
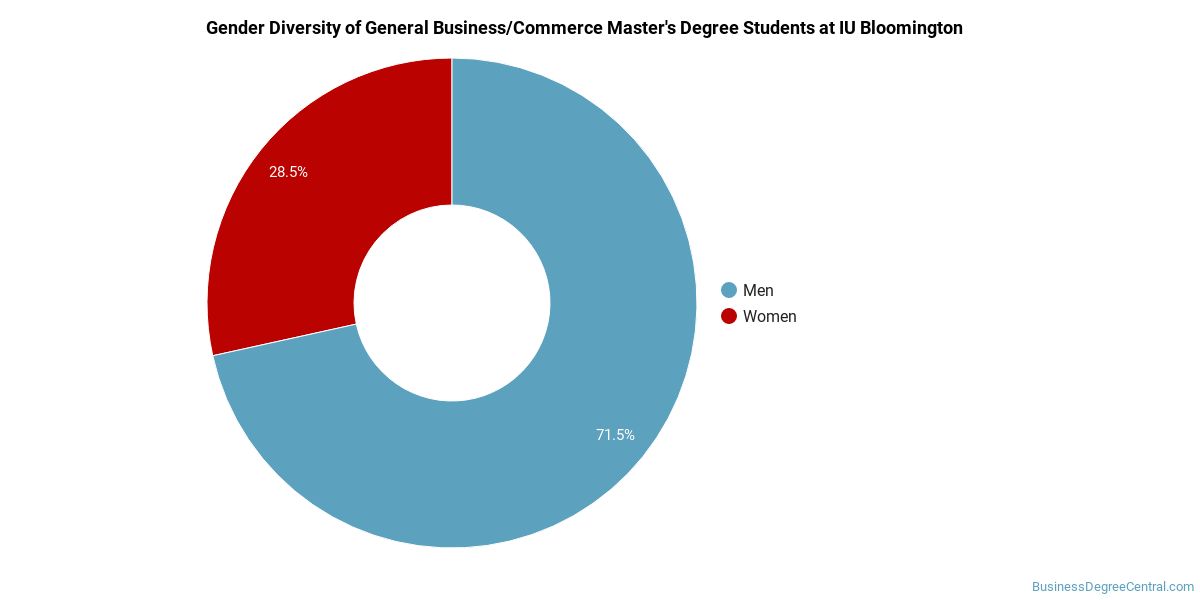
Business & Commerce Master’s Program at Indiana University-Bloomington
Of the 1,026 master’s business & commerce graduates at Indiana University-Bloomington, 30% were women (307) and 70% were men (719).
The following table and chart show the race/ethnicity of Business & Commerce master’s degree recipients at Indiana University-Bloomington.
| Race / Ethnicity | Number of Graduates |
|---|---|
| White | 536 |
| Hispanic / Latino | 62 |
| Black / African American | 37 |
| Asian | 140 |
| Two or More Races | 19 |
| International (Nonresident) | 201 |
| Unknown | 31 |
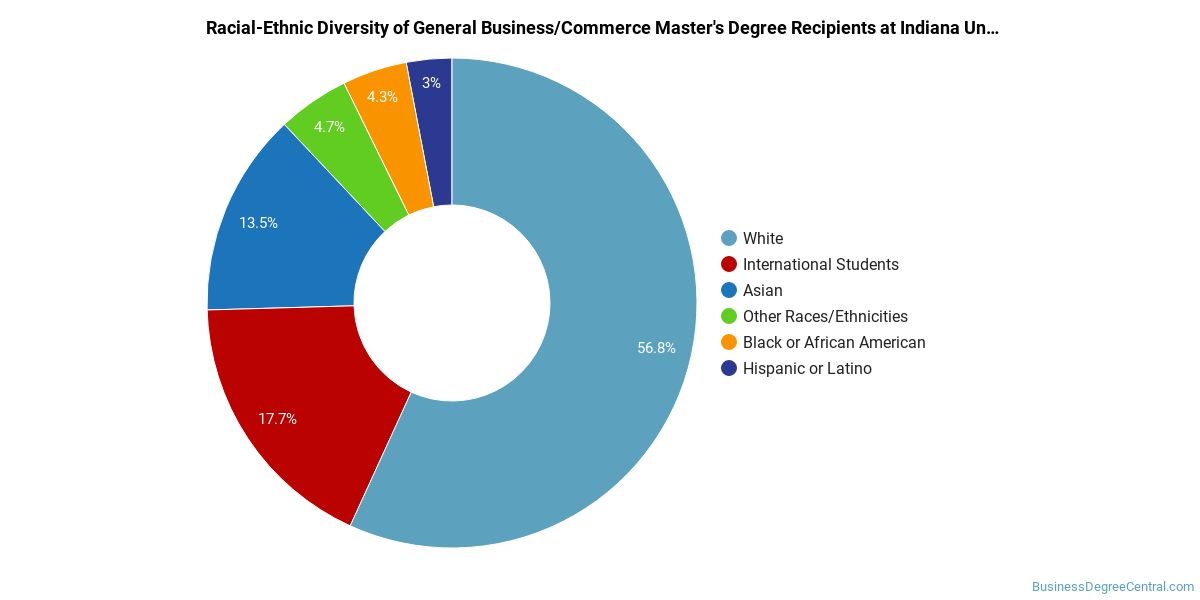
Racial-ethnic minorities make up 25% of Business & Commerce master’s degree recipients at Indiana University-Bloomington, lower than the national average of 28%.*
Business & Commerce Doctoral Program at Indiana University-Bloomington
Among the 10 doctoral business & commerce graduates at Indiana University-Bloomington, 30% were women (3) and 70% were men (7).

The following table and chart show the race/ethnicity of Business & Commerce doctoral degree recipients at Indiana University-Bloomington.
| Race / Ethnicity | Number of Graduates |
|---|---|
| White | 1 |
| Asian | 1 |
| Two or More Races | 1 |
| International (Nonresident) | 7 |

Minority students account for 20% of Business & Commerce doctoral degree recipients at Indiana University-Bloomington, below the national average of 27%.*
*The racial-ethnic minorities figure is the total number of graduates minus White, international (nonresident), and unknown-race graduates.
More Specific Business & Commerce Concentrations at Indiana University-Bloomington
This Business & Commerce program at Indiana University-Bloomington offers more specialized concentrations:
| Concentration | Graduates |
|---|---|
| General Business & Commerce | 3,530 |
Highest-Paying Careers for Business & Commerce Graduates
Graduates of the Business & Commerce program at Indiana University-Bloomington pursue many career paths. The table below ranks the top-paying careers for Business & Commerce graduates, ordered by median annual salary:
| Occupation | Nationwide Median Wage |
|---|---|
| Entertainment and Recreation Managers, Except Gambling | $170,172 |
| Loss Prevention Managers | $165,723 |
| Biofuels Production Managers | $164,096 |
| Geothermal Production Managers | $160,381 |
| Administrative Services Managers | $158,084 |
| Facilities Managers | $157,669 |
| Social and Community Service Managers | $156,089 |
| General and Operations Managers | $149,694 |
| Biomass Power Plant Managers | $146,025 |
| Chief Executives | $138,534 |
References
- IPEDS — Integrated Postsecondary Education Data System
- U.S. Department of Education — College Scorecard
- O*NET Online (Bureau of Labor Statistics)
- National Center for Education Statistics
More about our data sources and methodologies.
BusinessDegreeCentral.com provides higher-education, college and university, degree, program, career, salary, and other helpful information to students, faculty, institutions, and other internet audiences. Presented information and data are subject to change. Inclusion on this website does not imply or represent a direct relationship with the company, school, or brand. Information, though believed correct at time of publication, may not be correct, and no warranty is provided. Contact the schools to verify any information before relying on it. Financial aid may be available for those who qualify. The displayed options may include sponsored or recommended results, not necessarily based on your preferences.
© BusinessDegreeCentral.com – All Rights Reserved.