General Business & Commerce at College of Staten Island CUNY
If you plan to study General Business & Commerce, take a look at what College of Staten Island CUNY. The following information will help you decide if it is a good fit for you.
College of Staten Island CUNY is in Staten Island, NY.
During the most recent reporting year, 282 general business & commerce graduations were recorded at College of Staten Island CUNY.
Featured schools near , edit
Online Class Availability at College of Staten Island CUNY
Online coursework is an option at College of Staten Island CUNY. Of 11,033 students, 832 (8%) studied exclusively online and 4,153 (38%) took at least some classes online.
General Business & Commerce Rankings at College of Staten Island CUNY
Rankings can help you compare College of Staten Island CUNY’s General Business & Commerce program against peer institutions.
Bachelor’s-Level Rankings
| Ranking | Scope | Rank |
|---|---|---|
| Best Value | New York | #2 of 19 |
| Best Value | Middle Atlantic (Region) | #4 of 80 |
| Best Schools (Quality) | New York | #11 of 21 |
| Best Value | Nationwide | #31 of 561 |
| Best Schools (Quality) | Middle Atlantic (Region) | #45 of 84 |
| Best Schools (Quality) | Nationwide | #186 of 567 |
Associate-Level Rankings
| Ranking | Scope | Rank |
|---|---|---|
| Best Value | New York | #2 of 19 |
| Best Value | Middle Atlantic (Region) | #4 of 80 |
| Best Schools (Quality) | New York | #11 of 21 |
| Best Value | Nationwide | #31 of 561 |
| Best Schools (Quality) | Middle Atlantic (Region) | #45 of 84 |
| Best Schools (Quality) | Nationwide | #186 of 567 |
Student Demographics & Diversity
Below you’ll find the student demographics for General Business & Commerce graduates at College of Staten Island CUNY, broken down by degree level.
Across all degree levels, General Business & Commerce graduates at College of Staten Island CUNY are 39% women (110) and 61% men (172).
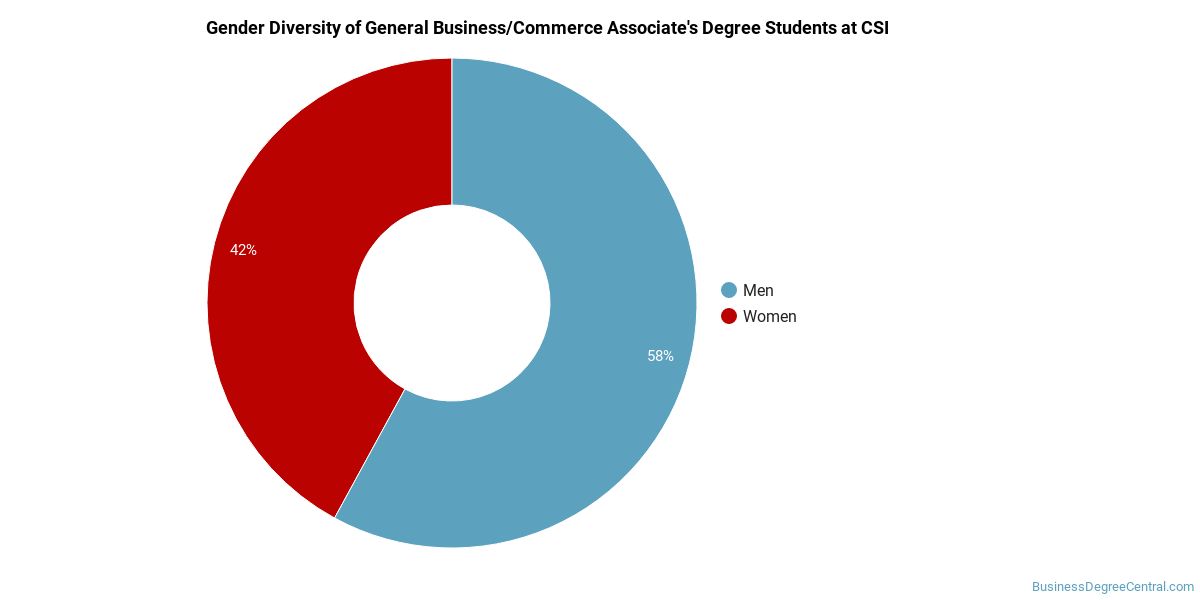
General Business & Commerce Associate’s Program at College of Staten Island CUNY
Of the 82 associate’s general business & commerce degrees awarded at College of Staten Island CUNY, 38% were women (31) and 62% were men (51).
The following table and chart show the race/ethnicity of General Business & Commerce associate’s degree recipients at College of Staten Island CUNY.
| Race / Ethnicity | Number of Graduates |
|---|---|
| White | 44 |
| Hispanic / Latino | 13 |
| Black / African American | 13 |
| Asian | 8 |
| Two or More Races | 3 |
| International (Nonresident) | 1 |
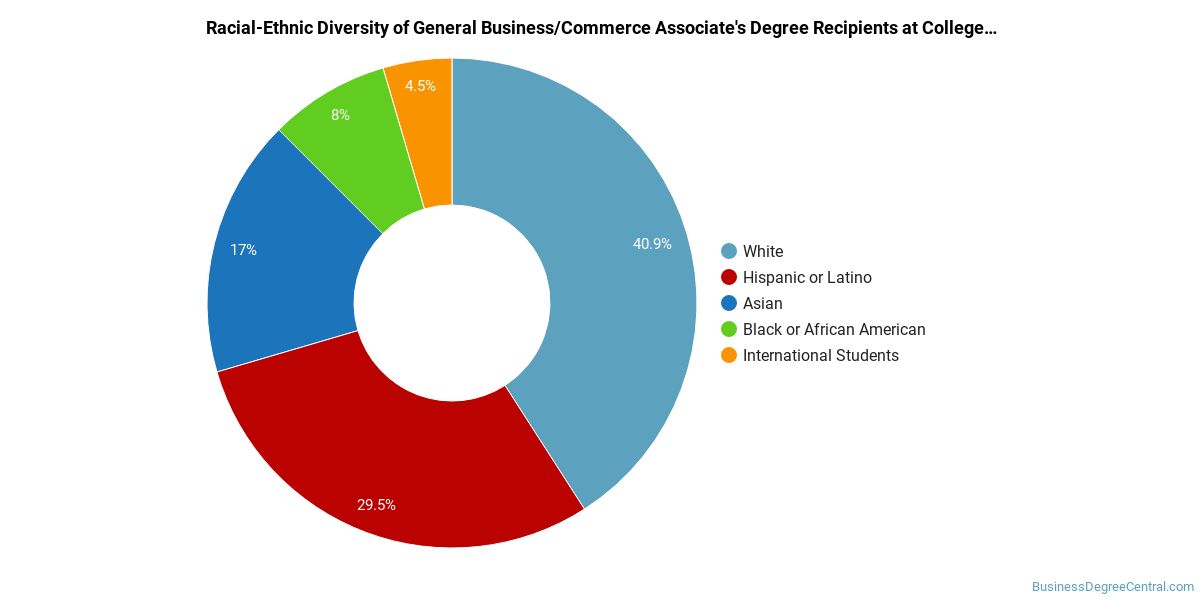
Minority students account for 45% of General Business & Commerce associate’s degree recipients at College of Staten Island CUNY, below the national average of 50%.*
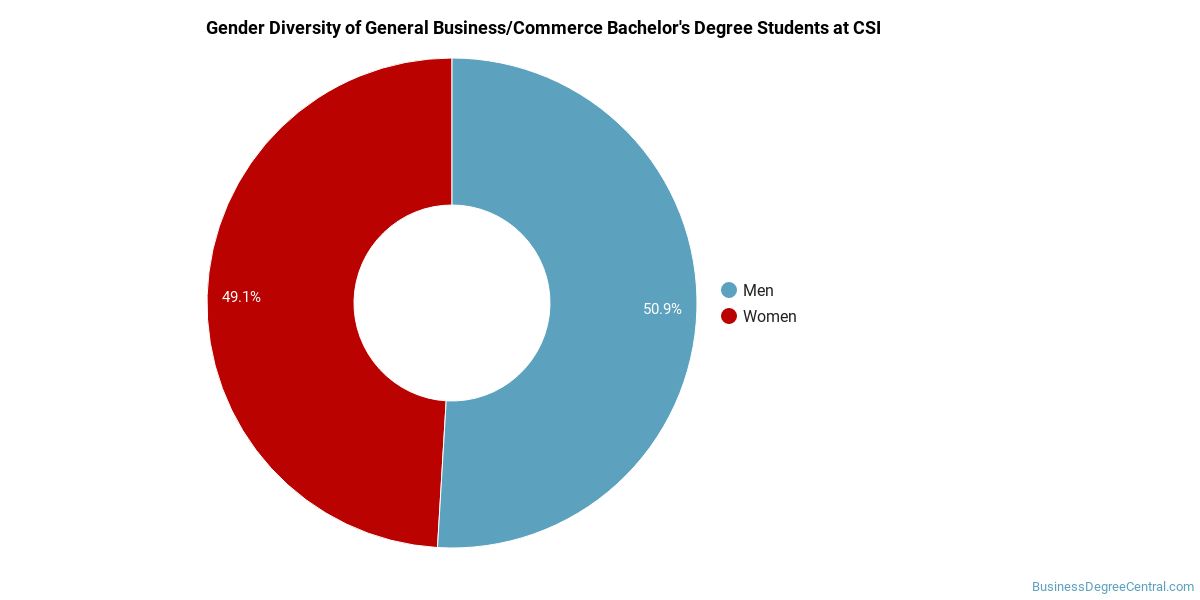
General Business & Commerce Bachelor’s Program at College of Staten Island CUNY
Of the 200 bachelor’s general business & commerce degrees awarded at College of Staten Island CUNY, 40% were women (79) and 60% were men (121).
The following table and chart show the race/ethnicity of General Business & Commerce bachelor’s degree recipients at College of Staten Island CUNY.
| Race / Ethnicity | Number of Graduates |
|---|---|
| White | 84 |
| Hispanic / Latino | 48 |
| Black / African American | 22 |
| Asian | 37 |
| Two or More Races | 4 |
| International (Nonresident) | 5 |
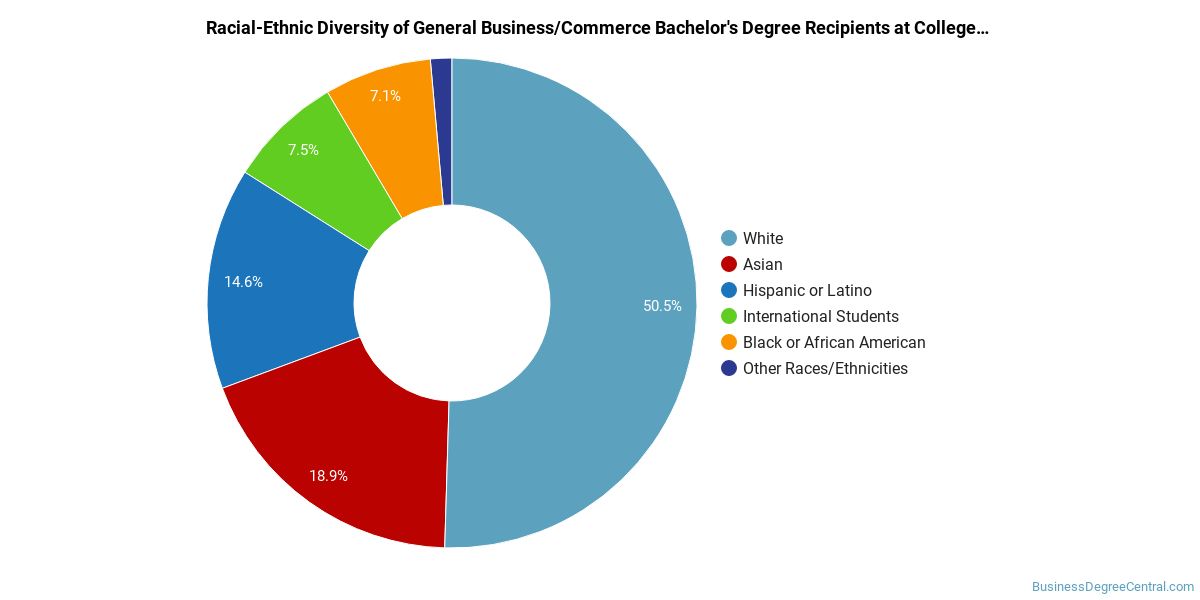
Racial-ethnic minorities make up 56% of General Business & Commerce bachelor’s degree recipients at College of Staten Island CUNY, above the national average of 37%.*
*The racial-ethnic minorities figure is the total number of graduates minus White, international (nonresident), and unknown-race graduates.
Best-Paid Careers for General Business & Commerce Graduates
Those who complete General Business & Commerce program at College of Staten Island CUNY work across a variety of fields. Below are the best-paid careers for General Business & Commerce majors, ordered by median annual salary:
| Occupation | Nationwide Median Wage |
|---|---|
| Entertainment and Recreation Managers, Except Gambling | $170,172 |
| Loss Prevention Managers | $165,723 |
| Biofuels Production Managers | $164,096 |
| Geothermal Production Managers | $160,381 |
| Administrative Services Managers | $158,084 |
| Facilities Managers | $157,669 |
| Social and Community Service Managers | $156,089 |
| General and Operations Managers | $149,694 |
| Biomass Power Plant Managers | $146,025 |
| Chief Executives | $138,534 |
References
- IPEDS — Integrated Postsecondary Education Data System
- U.S. Department of Education — College Scorecard
- O*NET Online (Bureau of Labor Statistics)
- National Center for Education Statistics
More about our data sources and methodologies.
BusinessDegreeCentral.com provides higher-education, college and university, degree, program, career, salary, and other helpful information to students, faculty, institutions, and other internet audiences. Presented information and data are subject to change. Inclusion on this website does not imply or represent a direct relationship with the company, school, or brand. Information, though believed correct at time of publication, may not be correct, and no warranty is provided. Contact the schools to verify any information before relying on it. Financial aid may be available for those who qualify. The displayed options may include sponsored or recommended results, not necessarily based on your preferences.
© BusinessDegreeCentral.com – All Rights Reserved.