General Business & Commerce at Columbia College
What traits are you looking for in a school for General Business & Commerce, consider the program at Columbia College. We’ve gathered the following information to help you decide.
Columbia College is located in Columbia, MO.
For the most recent IPEDS reporting year, 355 general business & commerce degrees were granted at Columbia College.
Featured schools near , edit
Online Class Availability at Columbia College
Many students take online classes at Columbia College. Among 5,689 students, 4,019 (71%) studied exclusively online and 695 (12%) took at least some classes online.
General Business & Commerce Rankings at Columbia College
Rankings can help you compare Columbia College’s General Business & Commerce program to other colleges that offer this major.
Bachelor’s-Level Rankings
| Ranking | Scope | Rank |
|---|---|---|
| Best Schools (Quality) | Missouri | #12 of 17 |
| Best Value | Missouri | #15 of 17 |
| Best Schools (Quality) | The Plains States (Region) | #47 of 54 |
| Best Value | The Plains States (Region) | #49 of 54 |
| Best Schools (Quality) | Nationwide | #396 of 567 |
| Best Value | Nationwide | #487 of 561 |
Master’s-Level Rankings
| Ranking | Scope | Rank |
|---|---|---|
| Best Schools (Quality) | Missouri | #12 of 17 |
| Best Value | Missouri | #15 of 17 |
| Best Schools (Quality) | The Plains States (Region) | #47 of 54 |
| Best Value | The Plains States (Region) | #49 of 54 |
| Best Schools (Quality) | Nationwide | #396 of 567 |
| Best Value | Nationwide | #487 of 561 |
Associate-Level Rankings
| Ranking | Scope | Rank |
|---|---|---|
| Best Schools (Quality) | Missouri | #12 of 17 |
| Best Value | Missouri | #15 of 17 |
| Best Schools (Quality) | The Plains States (Region) | #47 of 54 |
| Best Value | The Plains States (Region) | #49 of 54 |
| Best Schools (Quality) | Nationwide | #396 of 567 |
| Best Value | Nationwide | #487 of 561 |
Student Demographics & Diversity
Below you’ll find the composition of General Business & Commerce graduates at Columbia College, broken down by degree level.
Program-wide, General Business & Commerce graduates at Columbia College are 58% women (205) and 42% men (150).
General Business & Commerce Associate’s Program at Columbia College
Of the 78 associate’s general business & commerce degrees awarded at Columbia College, 63% were women (49) and 37% were men (29).

The following table and chart show the race/ethnicity of General Business & Commerce associate’s degree recipients at Columbia College.
| Race / Ethnicity | Number of Graduates |
|---|---|
| White | 38 |
| Hispanic / Latino | 11 |
| Black / African American | 18 |
| Asian | 2 |
| Two or More Races | 6 |
| International (Nonresident) | 1 |
| Unknown | 2 |
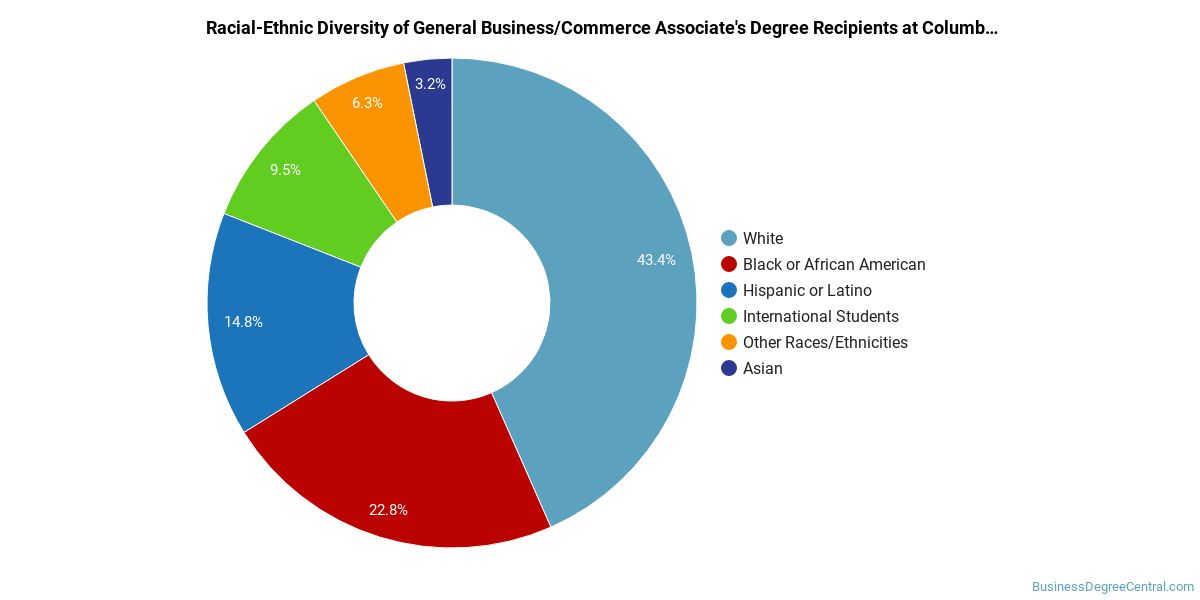
Minority students account for 47% of General Business & Commerce associate’s degree recipients at Columbia College, lower than the national average of 50%.*
General Business & Commerce Bachelor’s Program at Columbia College
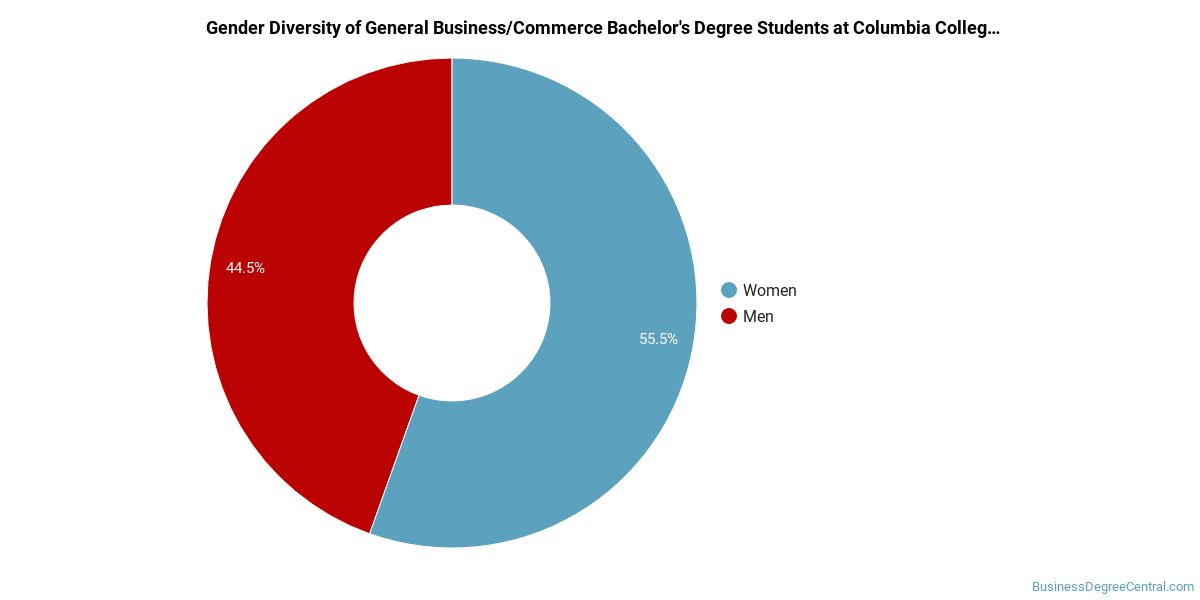
Among the 177 bachelor’s general business & commerce graduates at Columbia College, 49% were women (87) and 51% were men (90).
The following table and chart show the race/ethnicity of General Business & Commerce bachelor’s degree recipients at Columbia College.
| Race / Ethnicity | Number of Graduates |
|---|---|
| White | 103 |
| Hispanic / Latino | 17 |
| Black / African American | 35 |
| Asian | 2 |
| Native Hawaiian / Pacific Islander | 1 |
| Two or More Races | 9 |
| International (Nonresident) | 7 |
| Unknown | 3 |
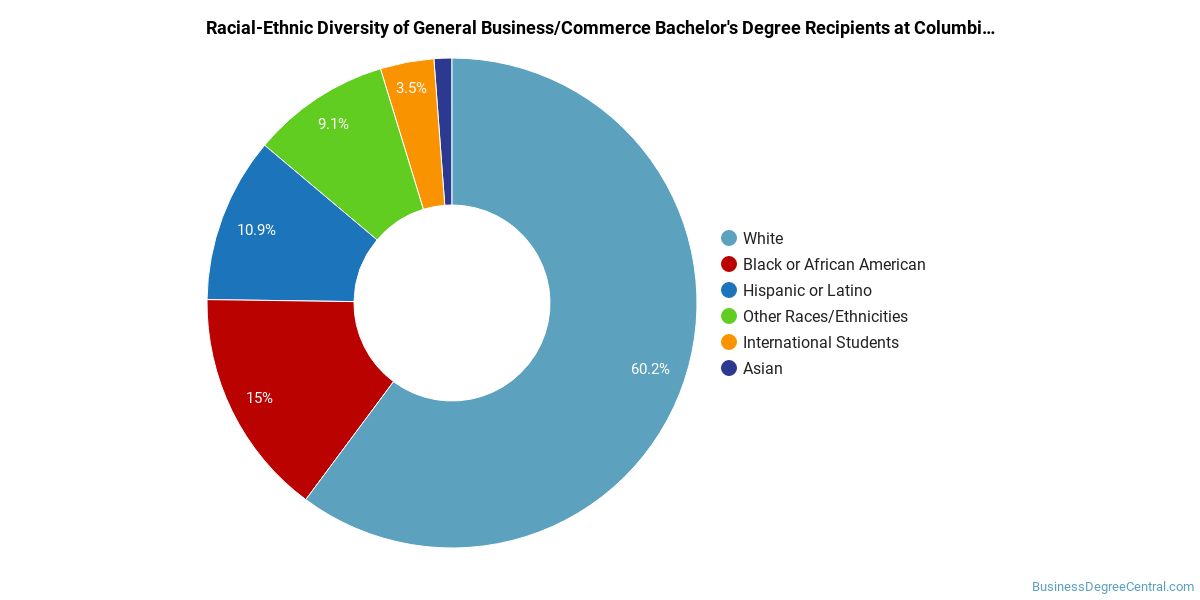
Minority students account for 36% of General Business & Commerce bachelor’s degree recipients at Columbia College, lower than the national average of 37%.*
General Business & Commerce Master’s Program at Columbia College
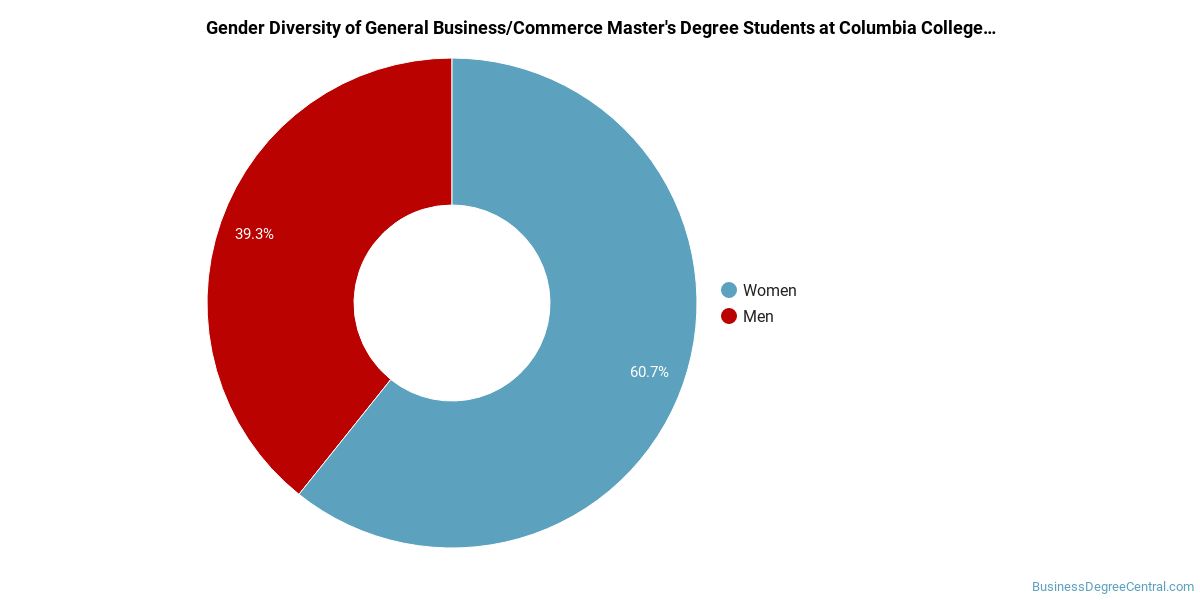
Of the 100 master’s general business & commerce degrees awarded at Columbia College, 69% were women (69) and 31% were men (31).
The following table and chart show the race/ethnicity of General Business & Commerce master’s degree recipients at Columbia College.
| Race / Ethnicity | Number of Graduates |
|---|---|
| White | 57 |
| Hispanic / Latino | 8 |
| Black / African American | 14 |
| Asian | 2 |
| American Indian / Alaska Native | 1 |
| Two or More Races | 8 |
| International (Nonresident) | 10 |
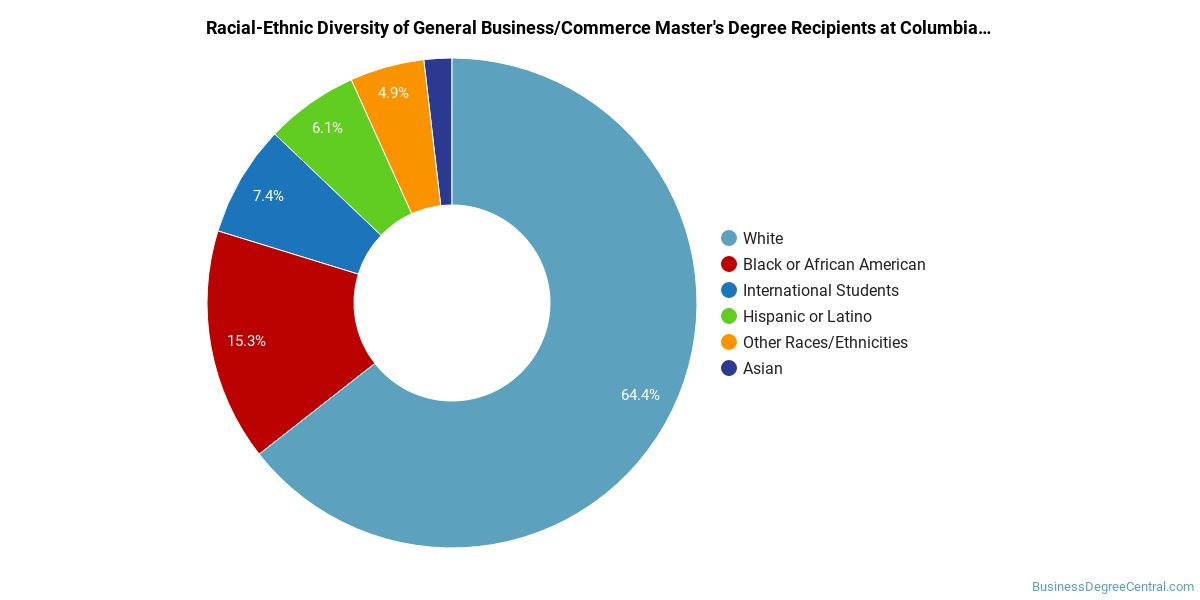
Racial-ethnic minorities make up 33% of General Business & Commerce master’s degree recipients at Columbia College, above the national average of 28%.*
*The racial-ethnic minorities figure is the total number of graduates minus White, international (nonresident), and unknown-race graduates.
Best-Paid Careers for General Business & Commerce Graduates
Graduates of the General Business & Commerce program at Columbia College pursue many career paths. Here are the highest-paying careers for General Business & Commerce graduates, ordered by median annual salary:
| Occupation | Nationwide Median Wage |
|---|---|
| Entertainment and Recreation Managers, Except Gambling | $170,172 |
| Loss Prevention Managers | $165,723 |
| Biofuels Production Managers | $164,096 |
| Geothermal Production Managers | $160,381 |
| Administrative Services Managers | $158,084 |
| Facilities Managers | $157,669 |
| Social and Community Service Managers | $156,089 |
| General and Operations Managers | $149,694 |
| Biomass Power Plant Managers | $146,025 |
| Chief Executives | $138,534 |
References
- IPEDS — Integrated Postsecondary Education Data System
- U.S. Department of Education — College Scorecard
- O*NET Online (Bureau of Labor Statistics)
- National Center for Education Statistics
More about our data sources and methodologies.
BusinessDegreeCentral.com provides higher-education, college and university, degree, program, career, salary, and other helpful information to students, faculty, institutions, and other internet audiences. Presented information and data are subject to change. Inclusion on this website does not imply or represent a direct relationship with the company, school, or brand. Information, though believed correct at time of publication, may not be correct, and no warranty is provided. Contact the schools to verify any information before relying on it. Financial aid may be available for those who qualify. The displayed options may include sponsored or recommended results, not necessarily based on your preferences.
© BusinessDegreeCentral.com – All Rights Reserved.