Financial Planning & Services
Featured schools near , edit
Types of Degrees Financial Planning & Services Majors Are Earning
People majoring in Financial Planning & Services may pursue degrees at several award levels.
| Award Level | Graduates |
|---|---|
| Certificate | 14 |
| Associate’s Degree | 11 |
| Bachelor’s Degree | 764 |
| Master’s Degree | 3,222 |
| Doctor’s Degree | 16 |
What Financial Planning & Services Majors Need to Know
Studies in Financial Planning & Services develop a specific mix of knowledge, skills, and abilities — derived from O*NET surveys of workers in occupations that Financial Planning & Services graduates commonly enter.
Knowledge Areas
Coursework in Financial Planning & Services emphasizes the following knowledge areas:

- Customer and Personal Service — Importance 4.4 / 5; level 5.1 / 7.
- English Language — Importance 4.0 / 5; level 4.2 / 7.
- Economics and Accounting — Importance 3.8 / 5; level 4.1 / 7.
- Mathematics — Importance 3.7 / 5; level 4.3 / 7.
- Sales and Marketing — Importance 3.3 / 5; level 4.0 / 7.
Importance is rated 1–5; level is 1–7. Source: ONET Online — weighted across related occupations.*
Skills
The skill set built by a Financial Planning & Services program reflects the day-to-day work of related occupations:
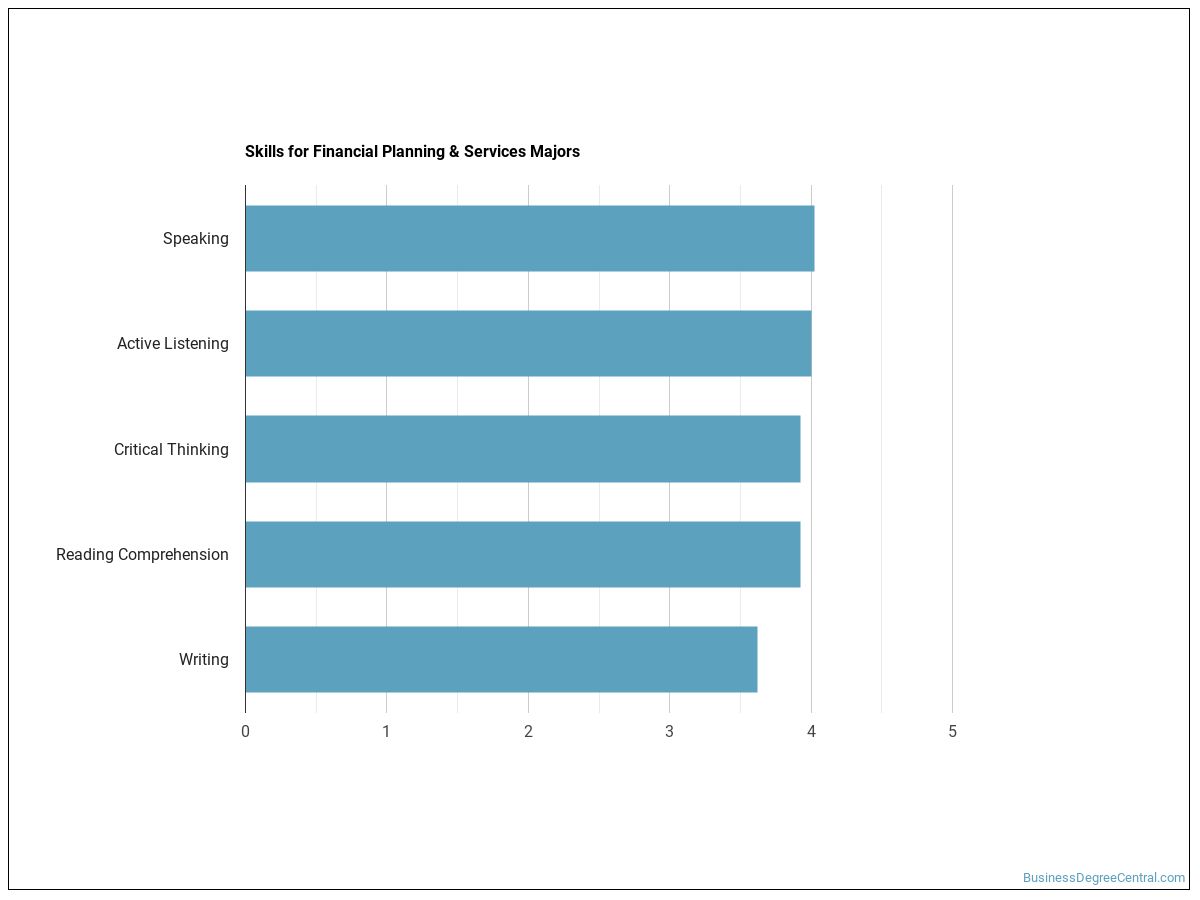
- Active Listening — Importance 3.9 / 5; level 3.9 / 7.
- Critical Thinking — Importance 3.8 / 5; level 3.9 / 7.
- Speaking — Importance 3.7 / 5; level 3.9 / 7.
- Reading Comprehension — Importance 3.7 / 5; level 3.9 / 7.
- Writing — Importance 3.6 / 5; level 3.8 / 7.
Abilities
The cognitive and physical abilities most relevant to Financial Planning & Services careers — again drawn from O*NET surveys of related occupations:
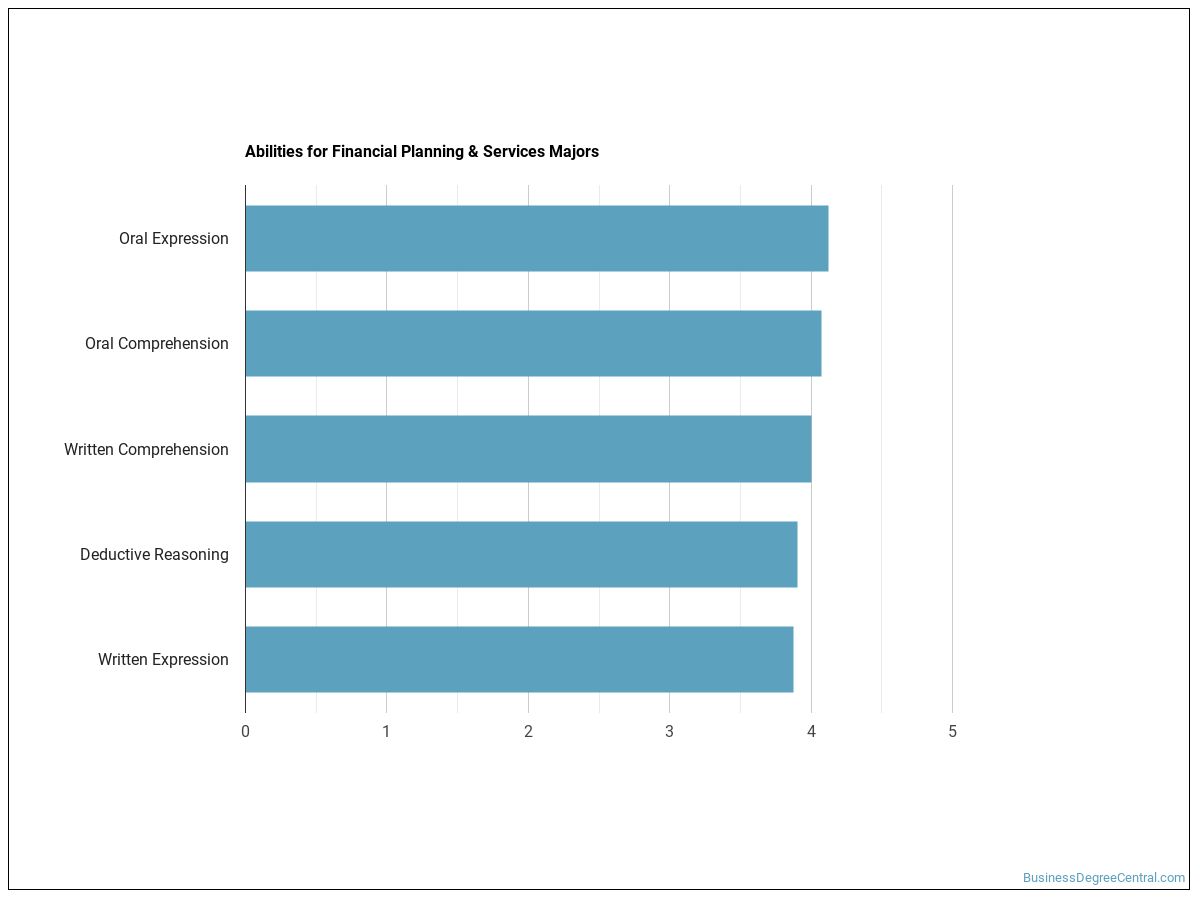
- Oral Comprehension — Importance 4.1 / 5; level 4.0 / 7.
- Oral Expression — Importance 4.0 / 5; level 4.3 / 7.
- Written Comprehension — Importance 3.8 / 5; level 4.1 / 7.
- Deductive Reasoning — Importance 3.8 / 5; level 4.2 / 7.
- Speech Clarity — Importance 3.6 / 5; level 3.7 / 7.
Common Job Activities
Day-to-day, Financial Planning & Services graduates report doing:
| Activity | Frequency / Importance |
|---|---|
| Working with Computers | 4.4 / 7 |
| Getting Information | 4.4 / 7 |
| Establishing and Maintaining Interpersonal Relationships | 4.1 / 7 |
| Making Decisions and Solving Problems | 4.1 / 7 |
| Updating and Using Relevant Knowledge | 4.1 / 7 |
| Processing Information | 4.1 / 7 |
| Communicating with People Outside the Organization | 4.0 / 7 |
| Analyzing Data or Information | 4.0 / 7 |
| Organizing, Planning, and Prioritizing Work | 3.9 / 7 |
| Communicating with Supervisors, Peers, or Subordinates | 3.8 / 7 |
Technology Skills Used on the Job
Most frequently-cited tools used by Financial Planning & Services professionals:
| Tool / Software | Category | In-Demand |
|---|---|---|
| Microsoft Word | Word processing software | ✓ |
| Microsoft PowerPoint | Presentation software | ✓ |
| Web browser software | Internet browser software | — |
| Microsoft Outlook | Electronic mail software | ✓ |
| Microsoft Office software | Office suite software | ✓ |
| Microsoft Excel | Spreadsheet software | ✓ |
| Microsoft Access | Data base user interface and query software | — |
| Email software | Electronic mail software | — |
| Sage 50 Accounting | Accounting software | — |
| Oracle PeopleSoft | Enterprise resource planning ERP software | — |
| SAP software | Enterprise resource planning ERP software | — |
| Fund accounting software | Accounting software | — |
Source: ONET Online technology skills, weighted across related occupations.*
Sample Job Titles
Real job postings for Financial Planning & Services graduates include:
- Financial Advisor
- Money Manager
- Investment Consultant
- Financial Consultant
- Account Manager
- Fiscal Specialist
- Chartered Financial Analyst (CFA)
- Personal Banker
- Real-Time Energy Trader
- Wholesale Account Executive
- Hybrid Derivatives Trader
- Banker
- Premier Banker
- Financial Specialist
- Banker Associate
What Can You Do With a Financial Planning & Services Degree?
Graduates with a degree in Financial Planning & Services commonly enter the following occupations:
| Occupation | Job Growth | Median Salary | 25th–75th Pctile |
|---|---|---|---|
| Securities, Commodities, and Financial Services Sales Agents | 9.2% | $49,944 | $39,642–$60,245 |
Job-growth = projected employment change for the parent occupation. Source: ONET / BLS Employment Projections.*
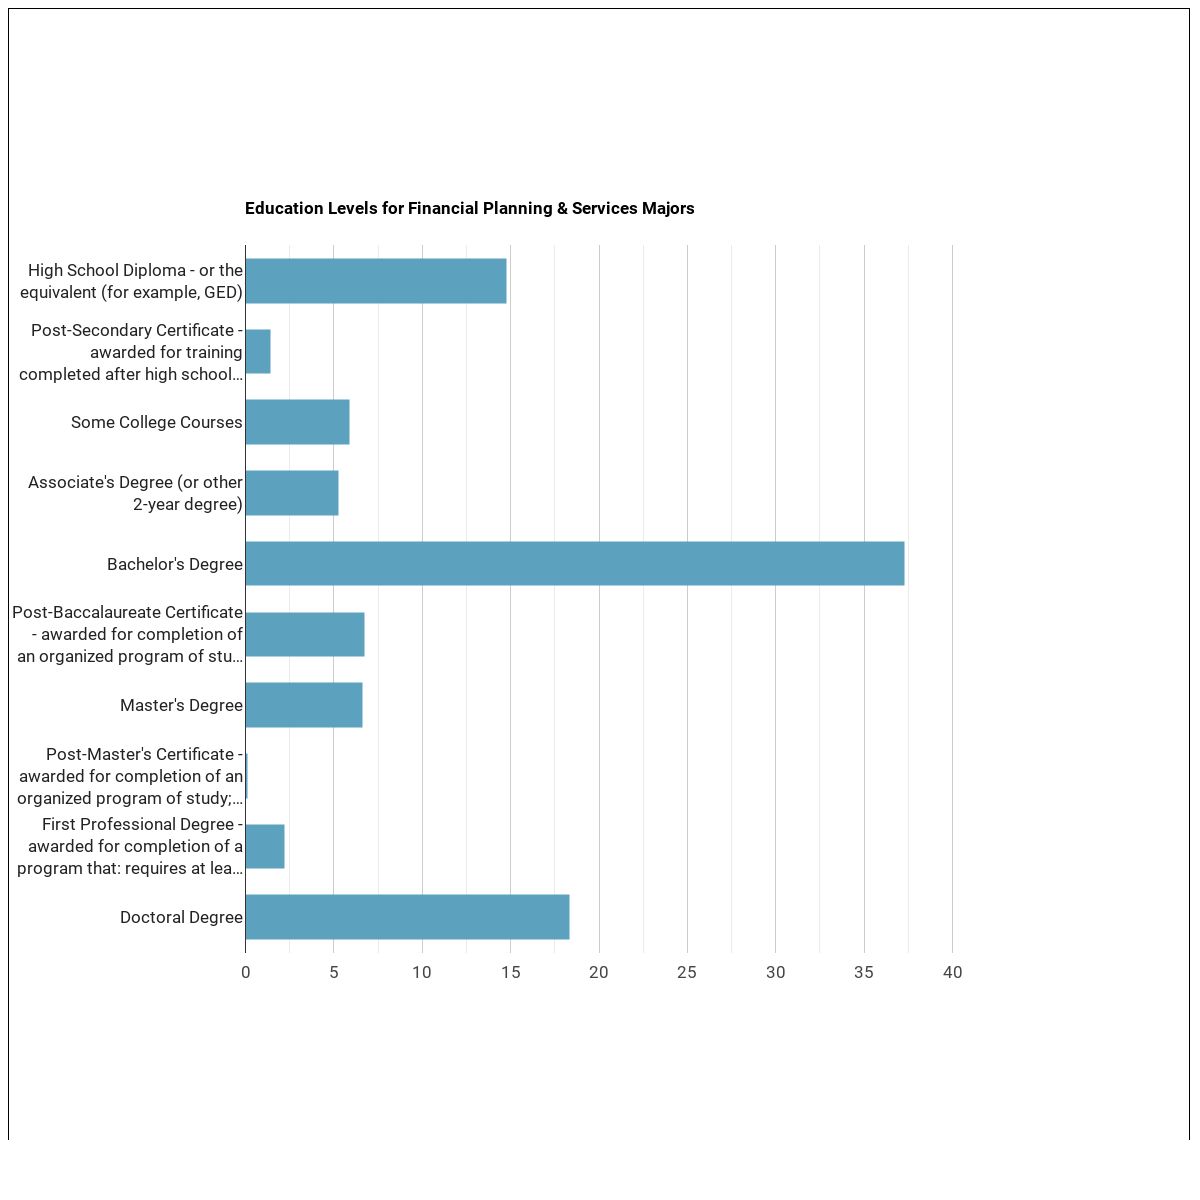
Education Typically Required
Across the occupations open to Financial Planning & Services graduates, the typical level of education actually held by current workers is distributed as:
| Education Level | Share of Workers |
|---|---|
| Bachelor’s degree | 48.2% |
| High school diploma or equivalent | 22.3% |
| Post-baccalaureate certificate | 6.9% |
| Doctoral degree | 6.2% |
| Master’s degree | 5.6% |
| Some college courses | 4.9% |
| Postsecondary certificate | 4.3% |
| Associate’s degree (or other 2-year) | 1.4% |
Source: ONET Online education / training / experience requirements.*
Who Is Earning a Degree in Financial Planning & Services?
Gender Distribution
This field skews predominantly male, with men earning 68.2% of Financial Planning & Services degrees.
| Gender | Graduates | Share |
|---|---|---|
| Women | 1,834 | 31.8% |
| Men | 3,939 | 68.2% |
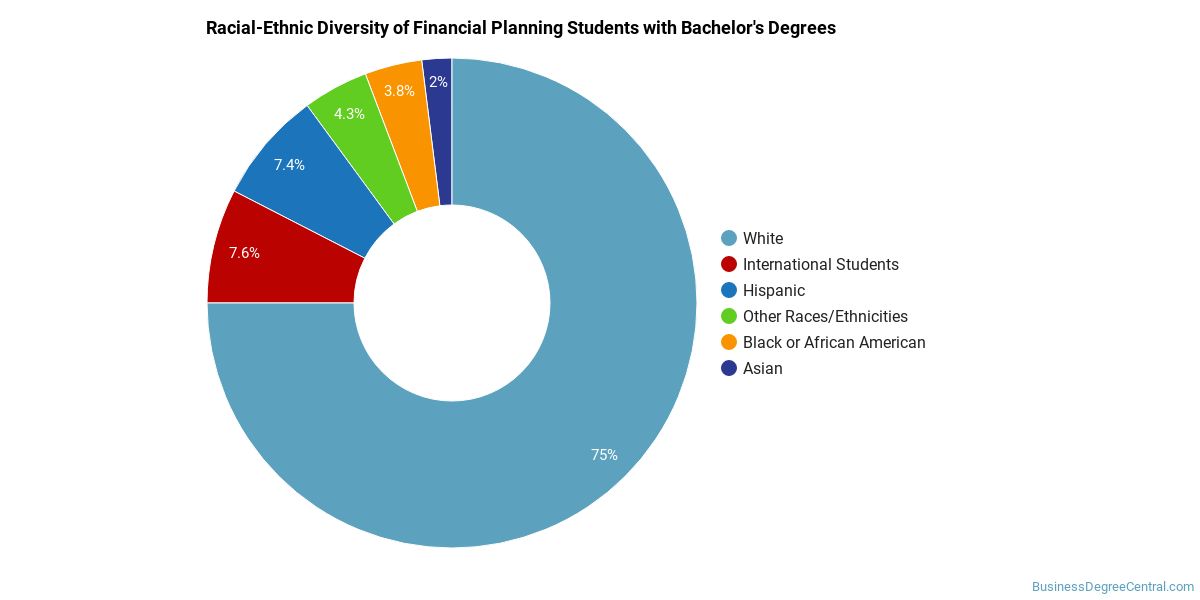
Racial-Ethnic Diversity
At the national level, the racial-ethnic distribution of Financial Planning & Services graduates is as follows:
| Race / Ethnicity | Graduates | Share |
|---|---|---|
| White | 2,503 | 43.4% |
| Asian | 169 | 2.9% |
| Hispanic or Latino | 147 | 2.5% |
| Black or African American | 157 | 2.7% |
| American Indian / Alaska Native | 17 | 0.3% |
| Native Hawaiian / Pacific Islander | 5 | 0.1% |
| Two or More Races | 82 | 1.4% |
| Race Unknown | 2,610 | 45.2% |
| International Students | 83 | 1.4% |
See minority definition below.
How Much Do Financial Planning & Services Graduates Earn?
Federal data tracks median earnings of Financial Planning & Services graduates 1, 4, and 5 years after completion. Earnings tend to climb steadily as graduates gain experience and move into mid-career roles.
| Years Out | Median Earnings |
|---|---|
| 1 year | $60,617 |
| 4 years | $75,528 |
| 5 years | $88,287 |
By year 5 out, median earnings rise to $88,287 — roughly 46% above the 1-year mark.
Source: U.S. Department of Education College Scorecard, field-of-study earnings tracker.
Online Financial Planning & Services Programs
Fully online options is reported by IPEDS for Financial Planning & Services. The table below shows how many graduates earned at least some of their coursework online (Distance-Ed Available) versus completing the entire program online (Distance-Ed Only).
| Award Level | Distance-Ed Available | Distance-Ed Only |
|---|---|---|
| Bachelor’s | 5 | 8 |
| Master’s | 11 | 6 |
| Doctoral (Research) | 1 | 1 |
Distance-Ed Only = degrees completed entirely online; Distance-Ed Available = degrees including at least some online coursework. Source: IPEDS Completions by Distance Education status.
Is a Degree in Financial Planning & Services Worth It?
Strictly by the federal earnings tracker, Financial Planning & Services graduates earn a median of $75,528 four years after completion — roughly 99% above the national median for workers with only a high school diploma (~$38,000).
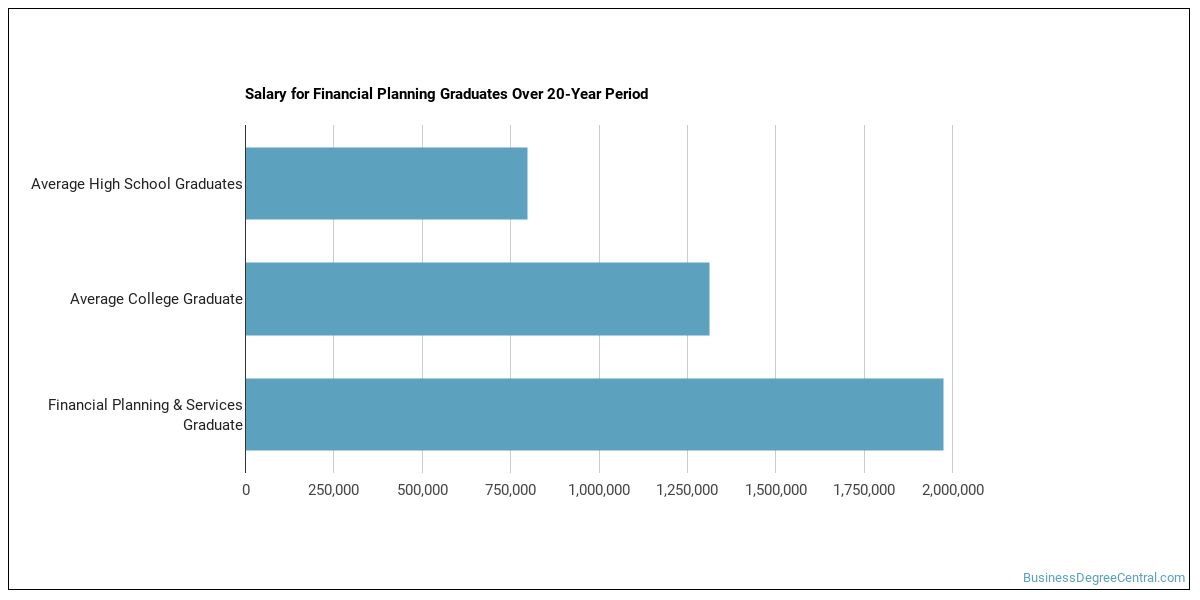
ROI estimate compares the program’s 4-yr median earnings against the 2023 BLS CPS median earnings for high-school-only workers. Source: U.S. Department of Education College Scorecard + BLS Current Population Survey.
Related Programs
You may also be interested in these closely related fields of study:
| Program | Annual Degrees Awarded |
|---|---|
| Business Administration and Management, General | 336,590 |
| Accounting | 58,956 |
| Finance and Financial Management Services | 57,564 |
| Finance, General | 49,828 |
| Business Statistics | 5,396 |
| Accounting and Finance | 3,502 |
| Actuarial Science | 1,363 |
| Accounting and Business/Management | 1,270 |
| Banking and Financial Support Services | 992 |
| Investments and Securities | 414 |
| Finance and Financial Management Services, Other | 363 |
| Auditing | 178 |
Explore Financial Planning & Services by State
Alabama
California
District of Columbia
Idaho
Kansas
Maryland
Mississippi
Nevada
New York
Oklahoma
South Carolina
Utah
West Virginia
Alaska
Colorado
Florida
Illinois
Kentucky
Massachusetts
Missouri
New Hampshire
North Carolina
Oregon
South Dakota
Vermont
Wisconsin
References
The racial-ethnic minorities count is calculated by taking the total number of students and subtracting white students and international students. This number is then divided by the total number of students to obtain the racial-ethnic minorities percentage.
- College Factual
- National Center for Education Statistics (IPEDS)
- O*NET Online
- U.S. Bureau of Labor Statistics
- U.S. Department of Education College Scorecard
More about our data sources and methodologies.
Featured Schools

You have goals. Southern New Hampshire University can help you get there. Whether you need a bachelor's degree to get into a career or want a master's degree to move up in your current career, SNHU has an online program for you. Find your degree from over 200 online programs.
Visit SchoolBusinessDegreeCentral.com provides higher-education, college and university, degree, program, career, salary, and other helpful information to students, faculty, institutions, and other internet audiences. Presented information and data are subject to change. Inclusion on this website does not imply or represent a direct relationship with the company, school, or brand. Information, though believed correct at time of publication, may not be correct, and no warranty is provided. Contact the schools to verify any information before relying on it. Financial aid may be available for those who qualify. The displayed options may include sponsored or recommended results, not necessarily based on your preferences.
© BusinessDegreeCentral.com – All Rights Reserved.