Management Sciences & Methods at University of Arkansas at Little Rock
What traits are you looking for in a school for Management Sciences & Methods, consider the program at University of Arkansas at Little Rock. Get started with the following essential facts.
University of Arkansas at Little Rock is in Little Rock, AR.
During the most recent reporting year, 44 management sciences & methods graduations were recorded at University of Arkansas at Little Rock.
Featured schools near , edit
Online & Distance Learning at University of Arkansas at Little Rock
Online coursework is an option at University of Arkansas at Little Rock. Among 8,216 students, 3,105 (38%) studied exclusively online and 2,490 (30%) took at least some classes online.
Management Sciences & Methods Rankings at University of Arkansas at Little Rock
Use these rankings to compare University of Arkansas at Little Rock’s Management Sciences & Methods program against peer institutions.
Bachelor’s-Level Rankings
| Ranking | Scope | Rank |
|---|---|---|
| Best Value | Arkansas | #4 of 6 |
| Best Schools (Quality) | Arkansas | #5 of 6 |
| Best Value | Southeast (Region) | #28 of 66 |
| Best Schools (Quality) | Southeast (Region) | #54 of 67 |
| Best Value | Nationwide | #118 of 325 |
| Best Schools (Quality) | Nationwide | #274 of 331 |
Master’s-Level Rankings
| Ranking | Scope | Rank |
|---|---|---|
| Best Value | Arkansas | #4 of 6 |
| Best Schools (Quality) | Arkansas | #5 of 6 |
| Best Value | Southeast (Region) | #28 of 66 |
| Best Schools (Quality) | Southeast (Region) | #54 of 67 |
| Best Value | Nationwide | #118 of 325 |
| Best Schools (Quality) | Nationwide | #274 of 331 |
Student Demographics & Diversity
The following sections describe the diversity of Management Sciences & Methods graduates at University of Arkansas at Little Rock, broken down by degree level.
Program-wide, Management Sciences & Methods graduates at University of Arkansas at Little Rock are 36% women (16) and 64% men (28).
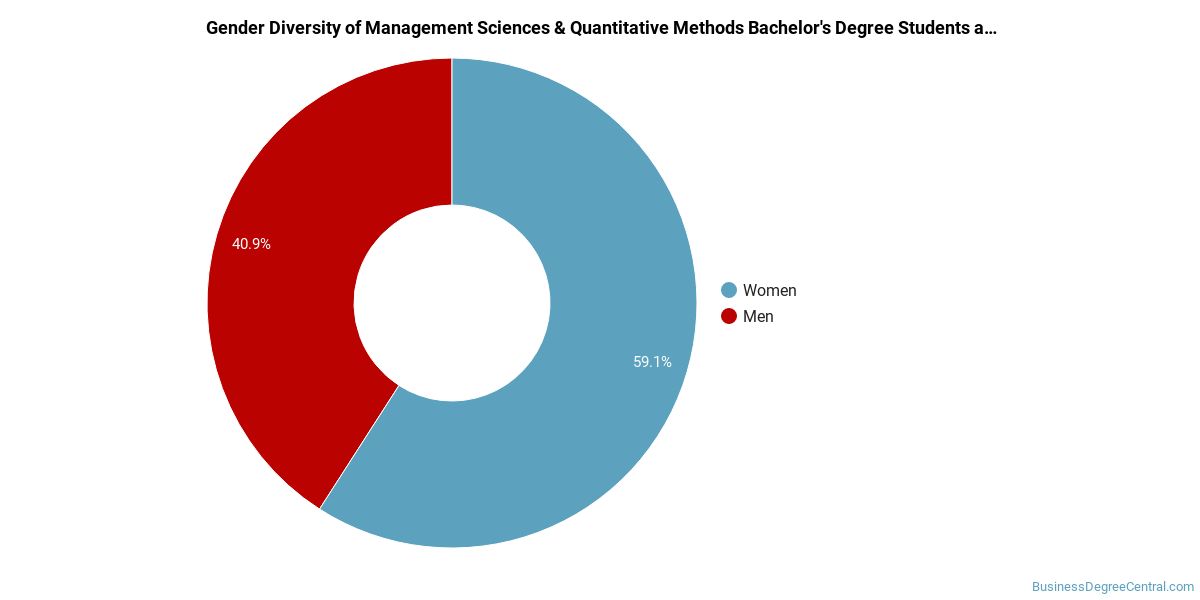
Management Sciences & Methods Bachelor’s Program at University of Arkansas at Little Rock
Of the 15 bachelor’s management sciences & methods degrees awarded at University of Arkansas at Little Rock, 33% were women (5) and 67% were men (10).
The following table and chart show the race/ethnicity of Management Sciences & Methods bachelor’s degree recipients at University of Arkansas at Little Rock.
| Race / Ethnicity | Number of Graduates |
|---|---|
| White | 8 |
| Hispanic / Latino | 1 |
| Black / African American | 5 |
| Two or More Races | 1 |
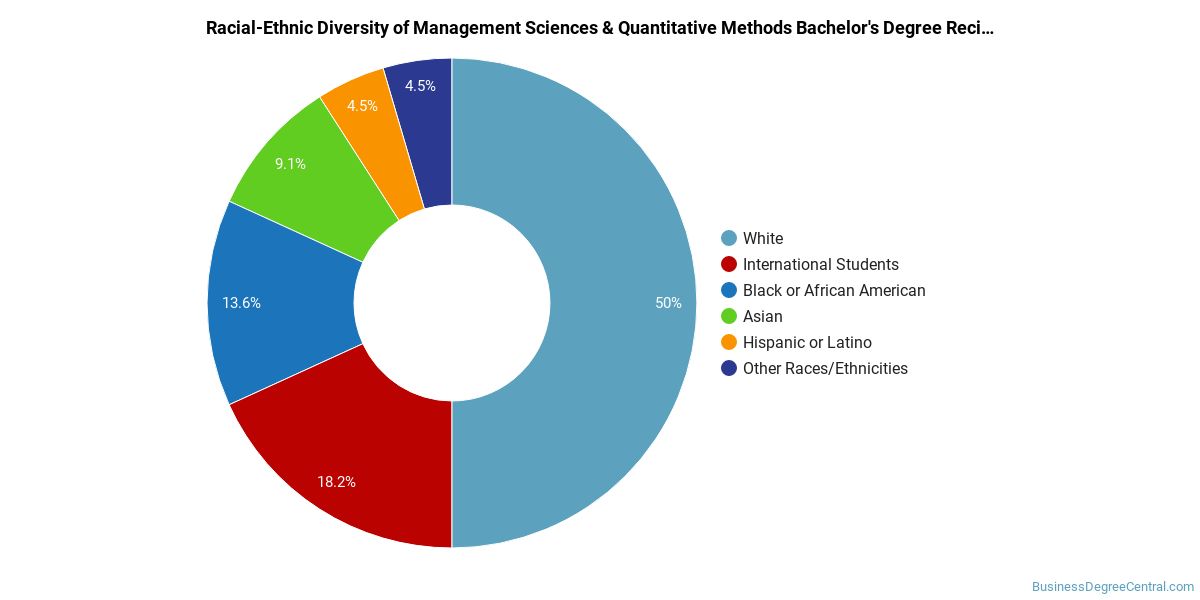
Minority students account for 47% of Management Sciences & Methods bachelor’s degree recipients at University of Arkansas at Little Rock, above the national average of 38%.*
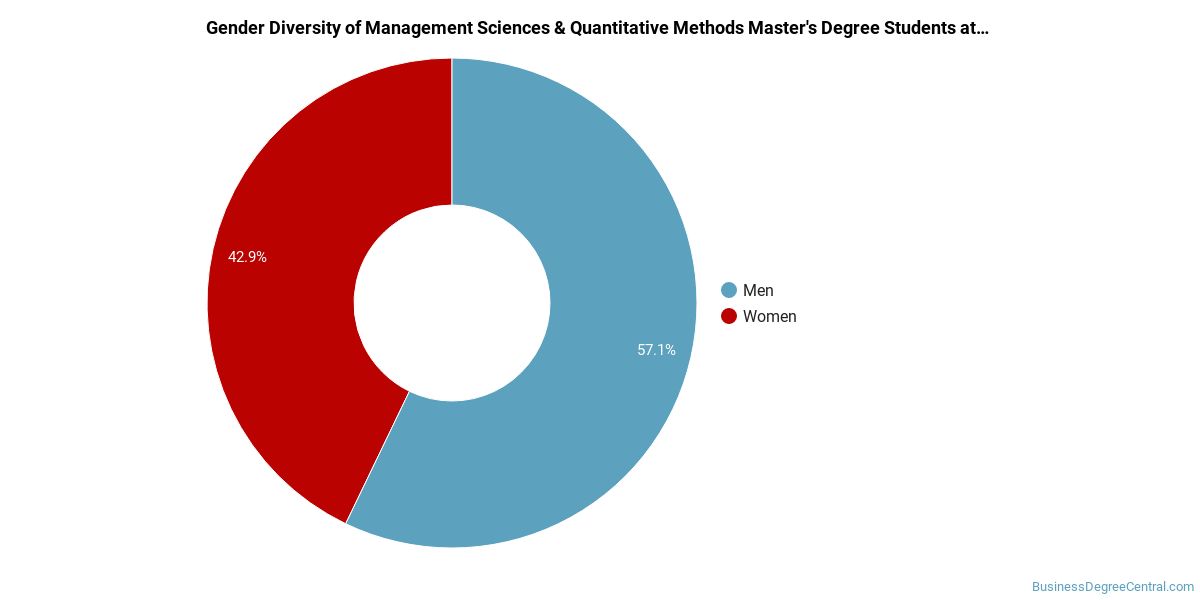
Management Sciences & Methods Master’s Program at University of Arkansas at Little Rock
Of the 15 master’s management sciences & methods graduates at University of Arkansas at Little Rock, 40% were women (6) and 60% were men (9).
The following table and chart show the race/ethnicity of Management Sciences & Methods master’s degree recipients at University of Arkansas at Little Rock.
| Race / Ethnicity | Number of Graduates |
|---|---|
| White | 2 |
| Black / African American | 1 |
| International (Nonresident) | 12 |
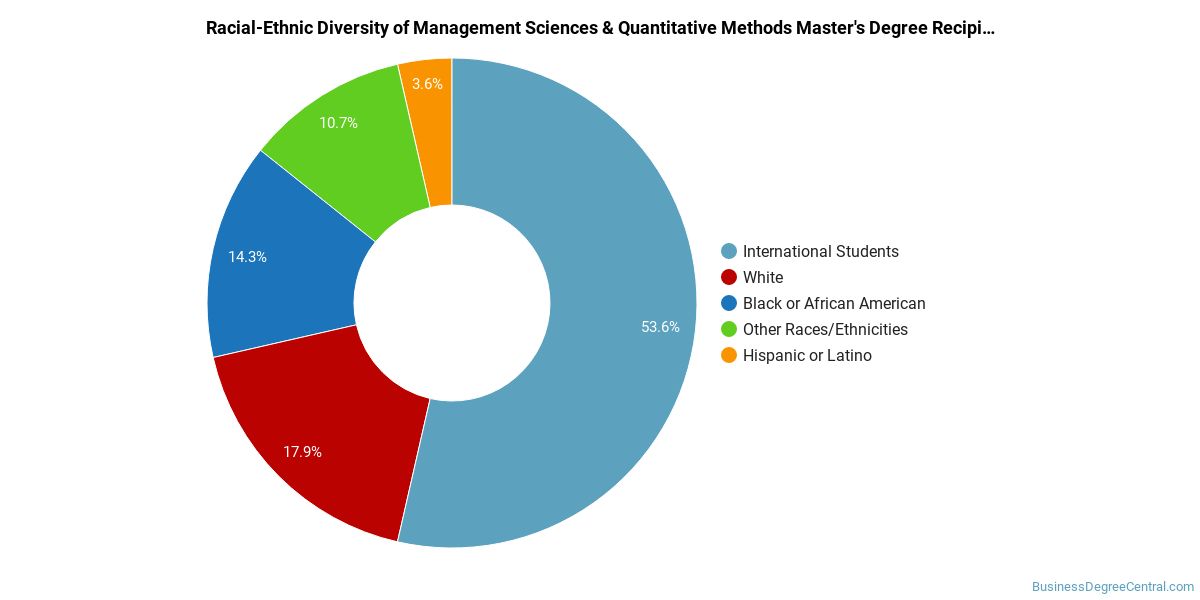
Minority students account for 7% of Management Sciences & Methods master’s degree recipients at University of Arkansas at Little Rock, lower than the national average of 23%.*
*The racial-ethnic minorities figure is the total number of graduates minus White, international (nonresident), and unknown-race graduates.
More Specific Management Sciences & Methods Concentrations at University of Arkansas at Little Rock
This Management Sciences & Methods program at University of Arkansas at Little Rock offers more specialized concentrations:
| Concentration | Graduates |
|---|---|
| Management Science | 44 |
Top-Paying Careers for Management Sciences & Methods Graduates
Graduates of the Management Sciences & Methods program at University of Arkansas at Little Rock pursue many career paths. The table below ranks the highest-paying careers for Management Sciences & Methods graduates, ordered by median annual salary:
| Occupation | Nationwide Median Wage |
|---|---|
| General and Operations Managers | $149,694 |
| Chief Executives | $138,534 |
| Statisticians | $130,349 |
| Insurance Underwriters | $129,939 |
| Financial Risk Specialists | $127,364 |
| Biostatisticians | $121,594 |
| Chief Sustainability Officers | $96,628 |
| Management Analysts | $51,034 |
References
- IPEDS — Integrated Postsecondary Education Data System
- U.S. Department of Education — College Scorecard
- O*NET Online (Bureau of Labor Statistics)
- National Center for Education Statistics
More about our data sources and methodologies.
BusinessDegreeCentral.com provides higher-education, college and university, degree, program, career, salary, and other helpful information to students, faculty, institutions, and other internet audiences. Presented information and data are subject to change. Inclusion on this website does not imply or represent a direct relationship with the company, school, or brand. Information, though believed correct at time of publication, may not be correct, and no warranty is provided. Contact the schools to verify any information before relying on it. Financial aid may be available for those who qualify. The displayed options may include sponsored or recommended results, not necessarily based on your preferences.
© BusinessDegreeCentral.com – All Rights Reserved.