Business Administration & Management at Pacific University
What traits are you looking for in a school for Business Administration & Management, consider the program at Pacific University. The following information will help you decide if it is a good fit for you.
Pacific University is in Forest Grove, OR.
In the most recent year for which we have data, 60 business administration & management graduations were recorded at Pacific University.
Featured schools near , edit
Studying Online at Pacific University
Many students take online classes at Pacific University. Among 3,427 students, 339 (10%) were enrolled entirely in distance education and 985 (29%) took at least some classes online.
Business Administration & Management Rankings at Pacific University
These rankings give you a sense of how Pacific University’s Business Administration & Management program to other colleges that offer this major.
Bachelor’s-Level Rankings
| Ranking | Scope | Rank |
|---|---|---|
| Best Schools (Quality) | Oregon | #6 of 22 |
| Best Value | Oregon | #21 of 22 |
| Best Schools (Quality) | Far Western (Region) | #103 of 258 |
| Best Value | Far Western (Region) | #245 of 256 |
| Best Schools (Quality) | Nationwide | #481 of 1,908 |
| Best Value | Nationwide | #1870 of 1,935 |
Master’s-Level Rankings
| Ranking | Scope | Rank |
|---|---|---|
| Best Schools (Quality) | Oregon | #6 of 22 |
| Best Value | Oregon | #21 of 22 |
| Best Schools (Quality) | Far Western (Region) | #103 of 258 |
| Best Value | Far Western (Region) | #245 of 256 |
| Best Schools (Quality) | Nationwide | #481 of 1,908 |
| Best Value | Nationwide | #1870 of 1,935 |
Student Demographics & Diversity
The following sections describe the student demographics for Business Administration & Management graduates at Pacific University, broken down by degree level.
Program-wide, Business Administration & Management graduates at Pacific University are 38% women (23) and 62% men (37).
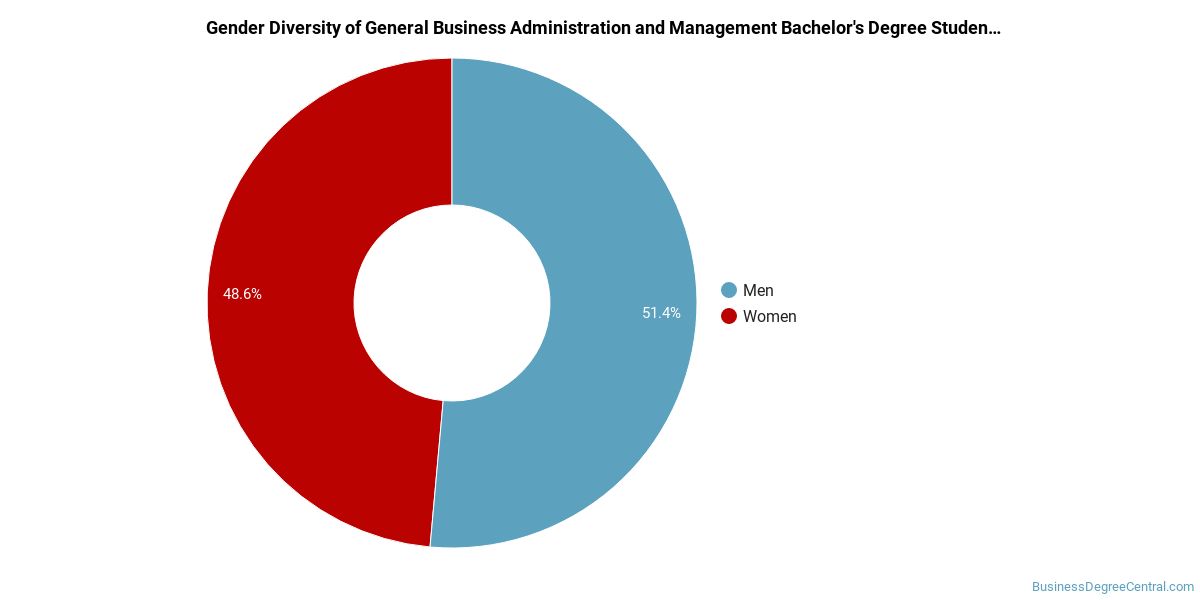
Business Administration & Management Bachelor’s Program at Pacific University
Of the 31 bachelor’s business administration & management graduates at Pacific University, 26% were women (8) and 74% were men (23).
The following table and chart show the race/ethnicity of Business Administration & Management bachelor’s degree recipients at Pacific University.
| Race / Ethnicity | Number of Graduates |
|---|---|
| White | 9 |
| Hispanic / Latino | 9 |
| Asian | 3 |
| Native Hawaiian / Pacific Islander | 1 |
| Two or More Races | 9 |
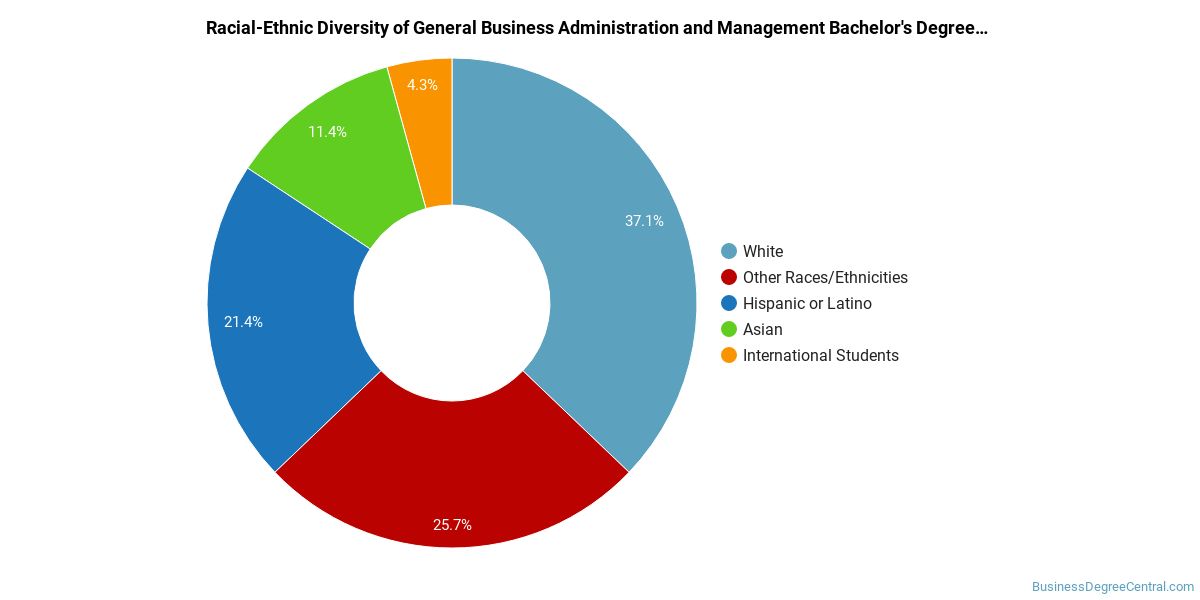
Minority students account for 71% of Business Administration & Management bachelor’s degree recipients at Pacific University, above the national average of 42%.*
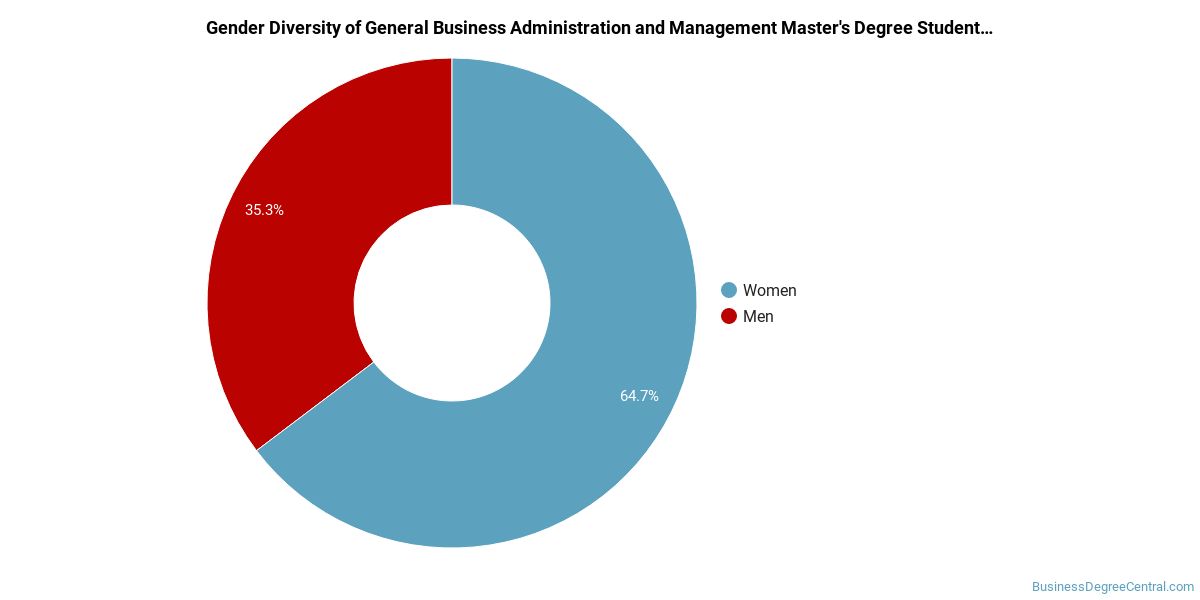
Business Administration & Management Master’s Program at Pacific University
Among the 29 master’s business administration & management degrees awarded at Pacific University, 52% were women (15) and 48% were men (14).
The following table and chart show the race/ethnicity of Business Administration & Management master’s degree recipients at Pacific University.
| Race / Ethnicity | Number of Graduates |
|---|---|
| White | 16 |
| Hispanic / Latino | 2 |
| Black / African American | 1 |
| Asian | 3 |
| American Indian / Alaska Native | 1 |
| Native Hawaiian / Pacific Islander | 1 |
| Two or More Races | 1 |
| International (Nonresident) | 2 |
| Unknown | 2 |
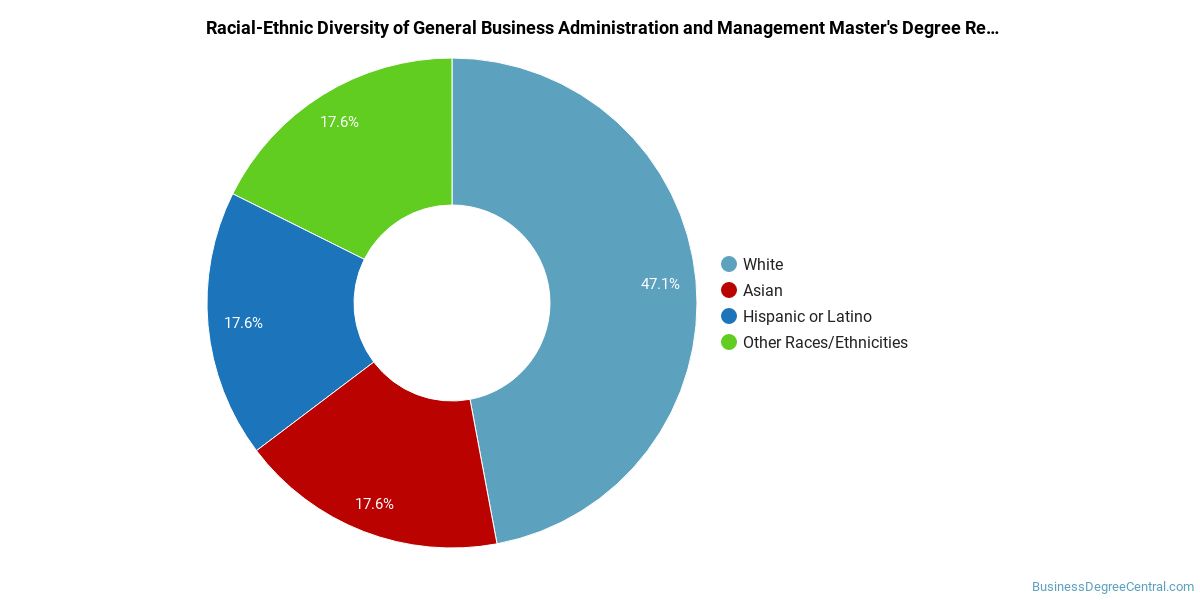
Minority students account for 31% of Business Administration & Management master’s degree recipients at Pacific University, below the national average of 36%.*
*The racial-ethnic minorities figure is the total number of graduates minus White, international (nonresident), and unknown-race graduates.
Highest-Paying Careers for Business Administration & Management Graduates
Students who finish Business Administration & Management program at Pacific University pursue many career paths. The table below ranks the top-paying careers for Business Administration & Management graduates, ordered by median annual salary:
| Occupation | Nationwide Median Wage |
|---|---|
| Loss Prevention Managers | $165,723 |
| Geothermal Production Managers | $160,381 |
| Administrative Services Managers | $158,084 |
| Facilities Managers | $157,669 |
| Biomass Power Plant Managers | $146,025 |
| Training and Development Managers | $139,524 |
| Chief Executives | $138,534 |
| Supply Chain Managers | $138,103 |
| Security Management Specialists | $128,654 |
| Industrial Production Managers | $126,666 |
References
- IPEDS — Integrated Postsecondary Education Data System
- U.S. Department of Education — College Scorecard
- O*NET Online (Bureau of Labor Statistics)
- National Center for Education Statistics
More about our data sources and methodologies.
BusinessDegreeCentral.com provides higher-education, college and university, degree, program, career, salary, and other helpful information to students, faculty, institutions, and other internet audiences. Presented information and data are subject to change. Inclusion on this website does not imply or represent a direct relationship with the company, school, or brand. Information, though believed correct at time of publication, may not be correct, and no warranty is provided. Contact the schools to verify any information before relying on it. Financial aid may be available for those who qualify. The displayed options may include sponsored or recommended results, not necessarily based on your preferences.
© BusinessDegreeCentral.com – All Rights Reserved.