Business Administration & Management at Franklin University
If you are interested in studying Business Administration & Management, consider the program at Franklin University. Get started with the following essential facts.
Franklin University is located in Columbus, OH.
During the most recent reporting year, 901 business administration & management graduations were recorded at Franklin University.
Featured schools near , edit
Studying Online at Franklin University
Many students take online classes at Franklin University. Among 9,457 students, 8,801 (93%) were enrolled entirely in distance education and 298 (3%) took at least some classes online.
Business Administration & Management Rankings at Franklin University
These rankings give you a sense of how Franklin University’s Business Administration & Management program against peer institutions.
Bachelor’s-Level Rankings
| Ranking | Scope | Rank |
|---|---|---|
| Best Schools (Quality) | Ohio | #31 of 66 |
| Best Value | Ohio | #50 of 67 |
| Best Schools (Quality) | Great Lakes (Region) | #153 of 266 |
| Best Value | Great Lakes (Region) | #219 of 272 |
| Best Schools (Quality) | Nationwide | #983 of 1,908 |
| Best Value | Nationwide | #1476 of 1,935 |
Master’s-Level Rankings
| Ranking | Scope | Rank |
|---|---|---|
| Best Schools (Quality) | Ohio | #31 of 66 |
| Best Value | Ohio | #50 of 67 |
| Best Schools (Quality) | Great Lakes (Region) | #153 of 266 |
| Best Value | Great Lakes (Region) | #219 of 272 |
| Best Schools (Quality) | Nationwide | #983 of 1,908 |
| Best Value | Nationwide | #1476 of 1,935 |
Doctoral-Level Rankings
| Ranking | Scope | Rank |
|---|---|---|
| Best Schools (Quality) | Ohio | #31 of 66 |
| Best Value | Ohio | #50 of 67 |
| Best Schools (Quality) | Great Lakes (Region) | #153 of 266 |
| Best Value | Great Lakes (Region) | #219 of 272 |
| Best Schools (Quality) | Nationwide | #983 of 1,908 |
| Best Value | Nationwide | #1476 of 1,935 |
Associate-Level Rankings
| Ranking | Scope | Rank |
|---|---|---|
| Best Schools (Quality) | Ohio | #31 of 66 |
| Best Value | Ohio | #50 of 67 |
| Best Schools (Quality) | Great Lakes (Region) | #153 of 266 |
| Best Value | Great Lakes (Region) | #219 of 272 |
| Best Schools (Quality) | Nationwide | #983 of 1,908 |
| Best Value | Nationwide | #1476 of 1,935 |
Student Demographics & Diversity
Take a look at the composition of Business Administration & Management graduates at Franklin University, by degree type.
Looking at the program as a whole, Business Administration & Management graduates at Franklin University are 59% women (534) and 41% men (367).
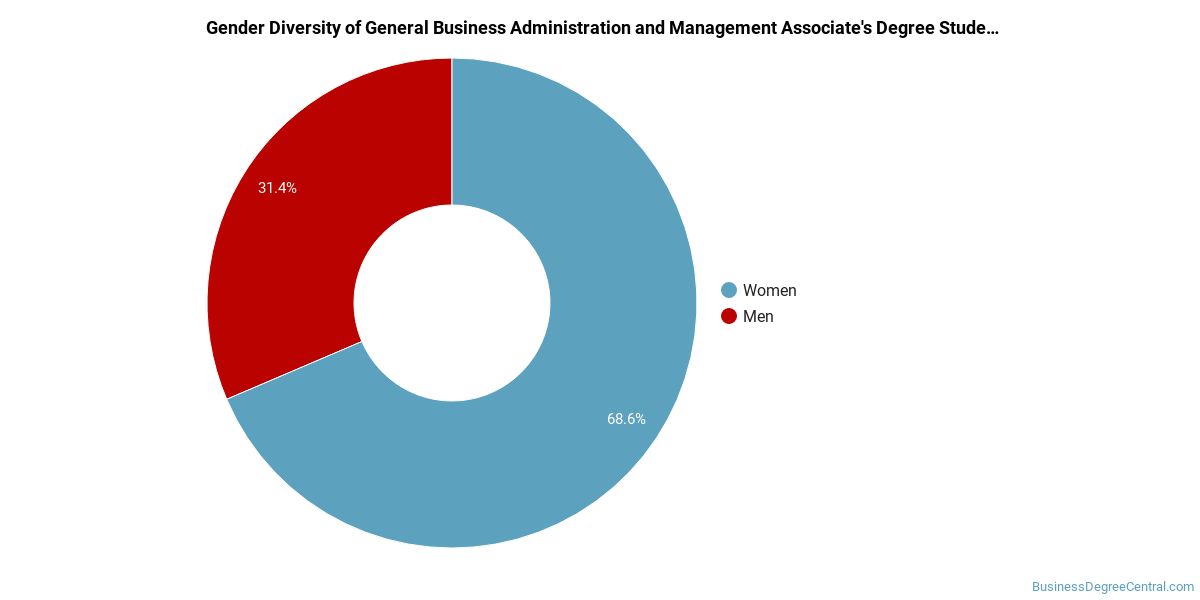
Business Administration & Management Associate’s Program at Franklin University
Among the 64 associate’s business administration & management degrees awarded at Franklin University, 52% were women (33) and 48% were men (31).
The following table and chart show the race/ethnicity of Business Administration & Management associate’s degree recipients at Franklin University.
| Race / Ethnicity | Number of Graduates |
|---|---|
| White | 30 |
| Hispanic / Latino | 3 |
| Black / African American | 26 |
| American Indian / Alaska Native | 1 |
| Two or More Races | 4 |
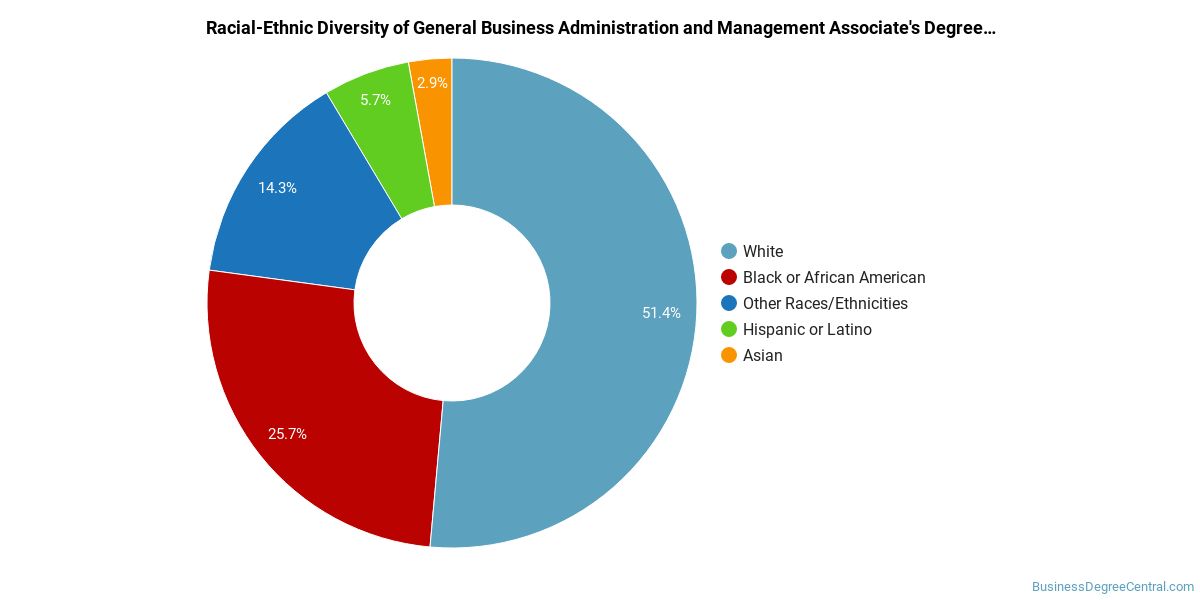
Racial-ethnic minorities make up 53% of Business Administration & Management associate’s degree recipients at Franklin University, higher than the national average of 52%.*
Business Administration & Management Bachelor’s Program at Franklin University
Of the 535 bachelor’s business administration & management graduates at Franklin University, 63% were women (337) and 37% were men (198).

The following table and chart show the race/ethnicity of Business Administration & Management bachelor’s degree recipients at Franklin University.
| Race / Ethnicity | Number of Graduates |
|---|---|
| White | 297 |
| Hispanic / Latino | 60 |
| Black / African American | 85 |
| Asian | 22 |
| American Indian / Alaska Native | 7 |
| Native Hawaiian / Pacific Islander | 2 |
| Two or More Races | 21 |
| International (Nonresident) | 3 |
| Unknown | 38 |
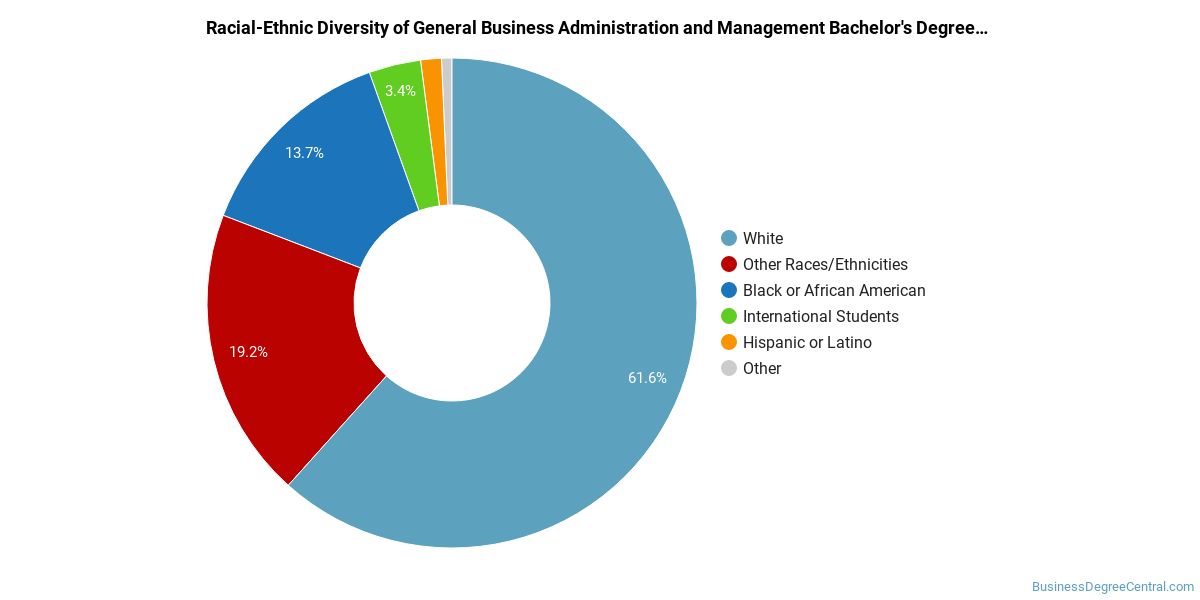
Racial-ethnic minorities make up 37% of Business Administration & Management bachelor’s degree recipients at Franklin University, below the national average of 42%.*
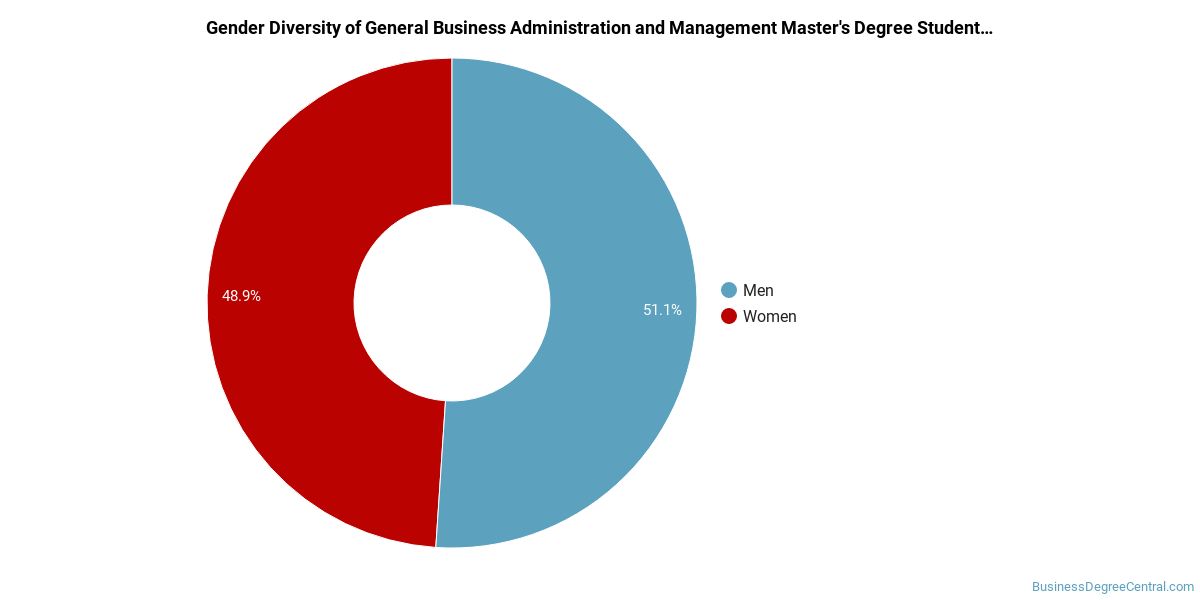
Business Administration & Management Master’s Program at Franklin University
Among the 281 master’s business administration & management graduates at Franklin University, 54% were women (153) and 46% were men (128).
The following table and chart show the race/ethnicity of Business Administration & Management master’s degree recipients at Franklin University.
| Race / Ethnicity | Number of Graduates |
|---|---|
| White | 129 |
| Hispanic / Latino | 17 |
| Black / African American | 60 |
| Asian | 36 |
| American Indian / Alaska Native | 3 |
| Two or More Races | 3 |
| International (Nonresident) | 8 |
| Unknown | 25 |
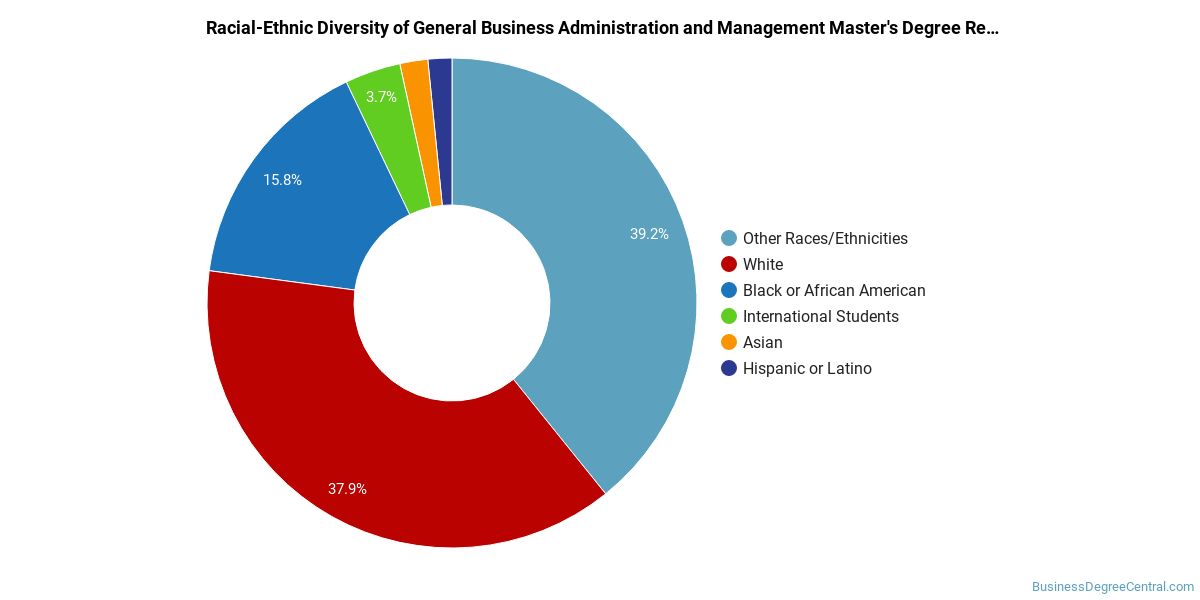
Racial-ethnic minorities make up 42% of Business Administration & Management master’s degree recipients at Franklin University, higher than the national average of 36%.*
Business Administration & Management Doctoral Program at Franklin University
Of the 21 doctoral business administration & management degrees awarded at Franklin University, 52% were women (11) and 48% were men (10).

The following table and chart show the race/ethnicity of Business Administration & Management doctoral degree recipients at Franklin University.
| Race / Ethnicity | Number of Graduates |
|---|---|
| White | 11 |
| Black / African American | 4 |
| Asian | 2 |
| American Indian / Alaska Native | 1 |
| Unknown | 3 |

Racial-ethnic minorities make up 33% of Business Administration & Management doctoral degree recipients at Franklin University, lower than the national average of 38%.*
*The racial-ethnic minorities figure is the total number of graduates minus White, international (nonresident), and unknown-race graduates.
Top-Paying Careers for Business Administration & Management Graduates
Those who complete Business Administration & Management program at Franklin University work across a variety of fields. Below are the top-paying careers for Business Administration & Management graduates, ordered by median annual salary:
| Occupation | Nationwide Median Wage |
|---|---|
| Loss Prevention Managers | $165,723 |
| Geothermal Production Managers | $160,381 |
| Administrative Services Managers | $158,084 |
| Facilities Managers | $157,669 |
| Biomass Power Plant Managers | $146,025 |
| Training and Development Managers | $139,524 |
| Chief Executives | $138,534 |
| Supply Chain Managers | $138,103 |
| Security Management Specialists | $128,654 |
| Industrial Production Managers | $126,666 |
References
- IPEDS — Integrated Postsecondary Education Data System
- U.S. Department of Education — College Scorecard
- O*NET Online (Bureau of Labor Statistics)
- National Center for Education Statistics
More about our data sources and methodologies.
BusinessDegreeCentral.com provides higher-education, college and university, degree, program, career, salary, and other helpful information to students, faculty, institutions, and other internet audiences. Presented information and data are subject to change. Inclusion on this website does not imply or represent a direct relationship with the company, school, or brand. Information, though believed correct at time of publication, may not be correct, and no warranty is provided. Contact the schools to verify any information before relying on it. Financial aid may be available for those who qualify. The displayed options may include sponsored or recommended results, not necessarily based on your preferences.
© BusinessDegreeCentral.com – All Rights Reserved.