Finance & Financial Management at Davenport University
What traits are you looking for in a school for Finance & Financial Management, you may want to check out the program at Davenport University. Get started with the following essential facts.
Davenport University sits in Grand Rapids, MI.
During the most recent reporting year, 44 finance & financial management degrees were granted at Davenport University.
Featured schools near , edit
Studying Online at Davenport University
Many students take online classes at Davenport University. Of 4,815 students, 2,536 (53%) studied exclusively online and 1,339 (28%) took at least some classes online.
Finance & Financial Management Rankings at Davenport University
Use these rankings to compare Davenport University’s Finance & Financial Management program against peer institutions.
Bachelor’s-Level Rankings
| Ranking | Scope | Rank |
|---|---|---|
| Best Value | Michigan | #15 of 19 |
| Best Schools (Quality) | Michigan | #20 of 20 |
| Best Value | Great Lakes (Region) | #66 of 105 |
| Best Schools (Quality) | Great Lakes (Region) | #105 of 106 |
| Best Value | Nationwide | #337 of 552 |
| Best Schools (Quality) | Nationwide | #529 of 555 |
Master’s-Level Rankings
| Ranking | Scope | Rank |
|---|---|---|
| Best Value | Michigan | #15 of 19 |
| Best Schools (Quality) | Michigan | #20 of 20 |
| Best Value | Great Lakes (Region) | #66 of 105 |
| Best Schools (Quality) | Great Lakes (Region) | #105 of 106 |
| Best Value | Nationwide | #337 of 552 |
| Best Schools (Quality) | Nationwide | #529 of 555 |
Associate-Level Rankings
| Ranking | Scope | Rank |
|---|---|---|
| Best Value | Michigan | #15 of 19 |
| Best Schools (Quality) | Michigan | #20 of 20 |
| Best Value | Great Lakes (Region) | #66 of 105 |
| Best Schools (Quality) | Great Lakes (Region) | #105 of 106 |
| Best Value | Nationwide | #337 of 552 |
| Best Schools (Quality) | Nationwide | #529 of 555 |
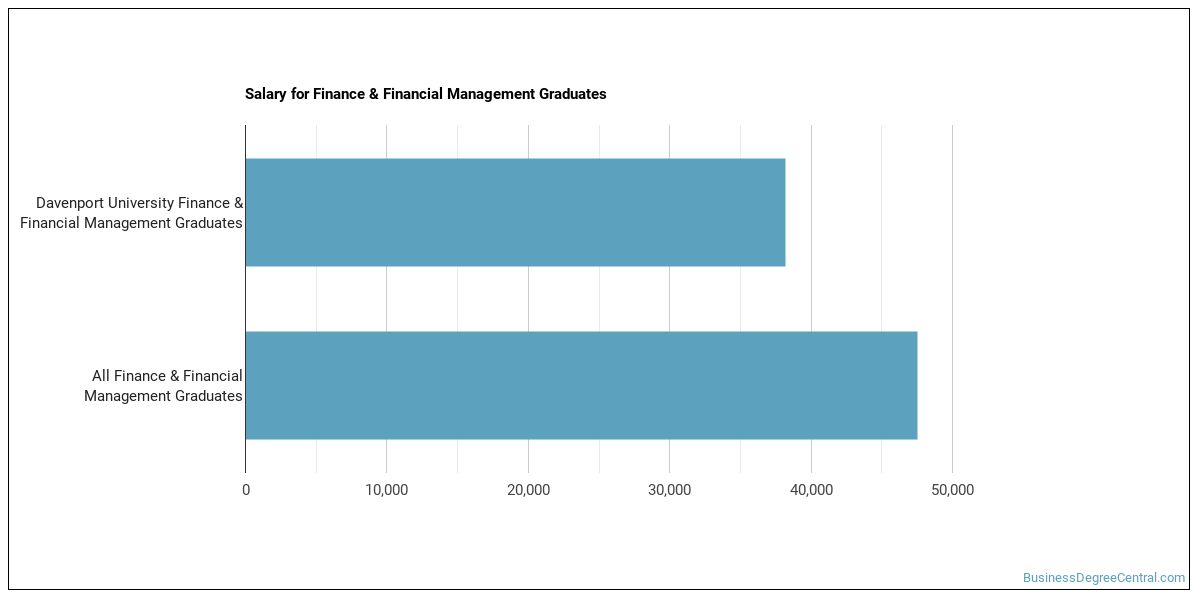
Earnings for Finance & Financial Management Graduates from Davenport University
Students who complete Davenport University’s Finance & Financial Management program earn at the following median levels (per the U.S. Department of Education’s College Scorecard):
| Years After Graduation | Median Earnings |
|---|---|
| 1 year | $48,726 |
| 2 years | $43,798 |
| 3 years | $51,905 |
| 4 years | $48,364 |
| 5 years | $57,608 |
Is this above or below average for the school? Four years out, Finance & Financial Management graduates from Davenport University report median earnings of $48,364, compared with $61,187 for all Davenport University graduates — about 21% lower than the school-wide median.

Median Debt at Graduation
Median student loan debt for Finance & Financial Management graduates from Davenport University stands at $30,567.
Student Demographics & Diversity
Take a look at the composition of Finance & Financial Management graduates at Davenport University, by degree type.
Looking at the program as a whole, Finance & Financial Management graduates at Davenport University are 34% women (15) and 66% men (29).
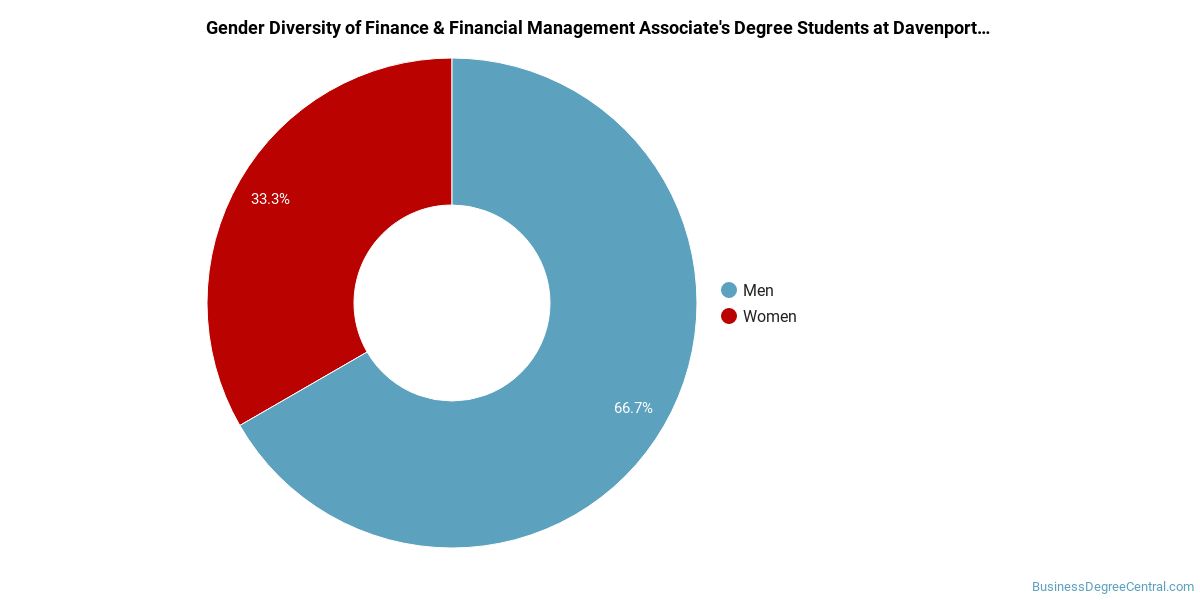
Finance & Financial Management Associate’s Program at Davenport University
Among the 7 associate’s finance & financial management degrees awarded at Davenport University, 57% were women (4) and 43% were men (3).
The following table and chart show the race/ethnicity of Finance & Financial Management associate’s degree recipients at Davenport University.
| Race / Ethnicity | Number of Graduates |
|---|---|
| White | 5 |
| Hispanic / Latino | 1 |
| International (Nonresident) | 1 |
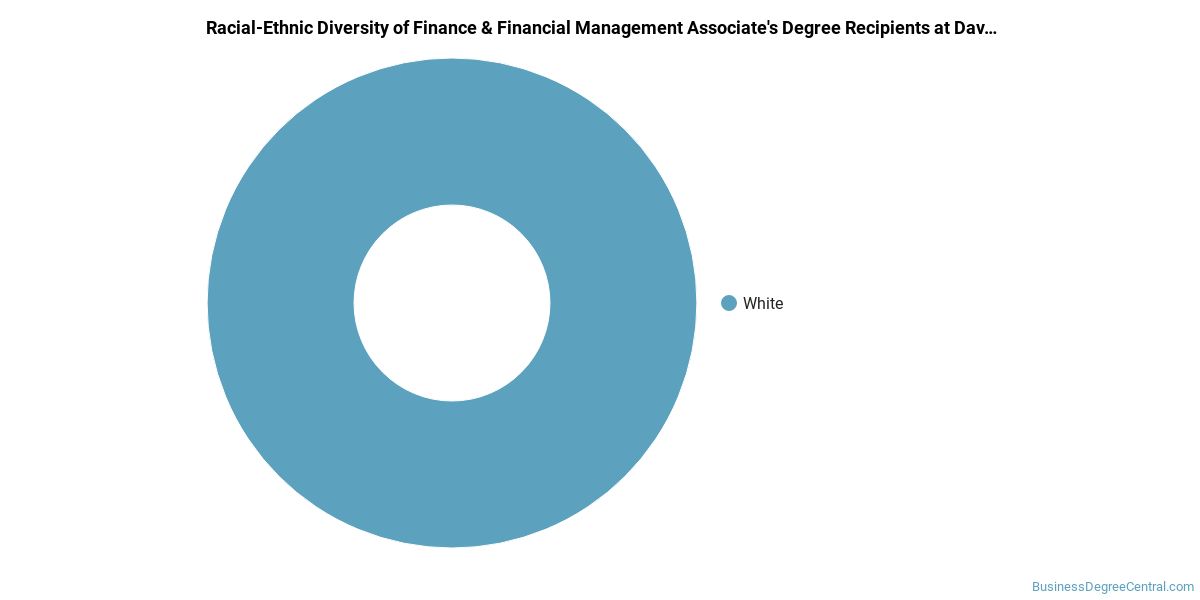
Racial-ethnic minorities make up 14% of Finance & Financial Management associate’s degree recipients at Davenport University, lower than the national average of 44%.*
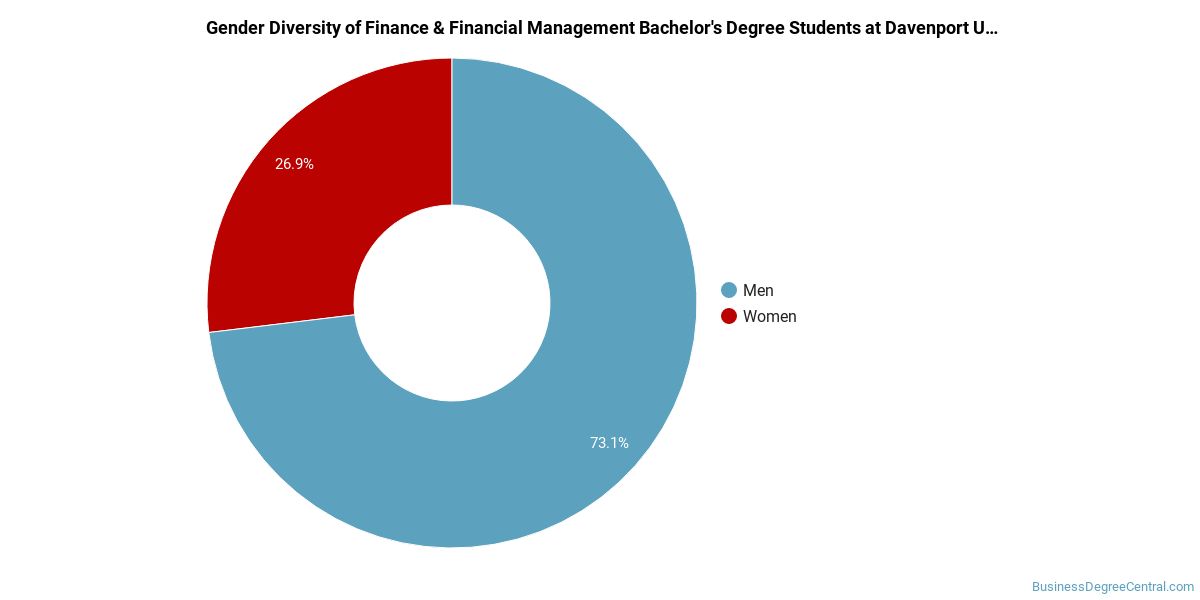
Finance & Financial Management Bachelor’s Program at Davenport University
Of the 32 bachelor’s finance & financial management graduates at Davenport University, 25% were women (8) and 75% were men (24).
The following table and chart show the race/ethnicity of Finance & Financial Management bachelor’s degree recipients at Davenport University.
| Race / Ethnicity | Number of Graduates |
|---|---|
| White | 23 |
| Hispanic / Latino | 2 |
| Black / African American | 2 |
| Two or More Races | 1 |
| International (Nonresident) | 2 |
| Unknown | 2 |
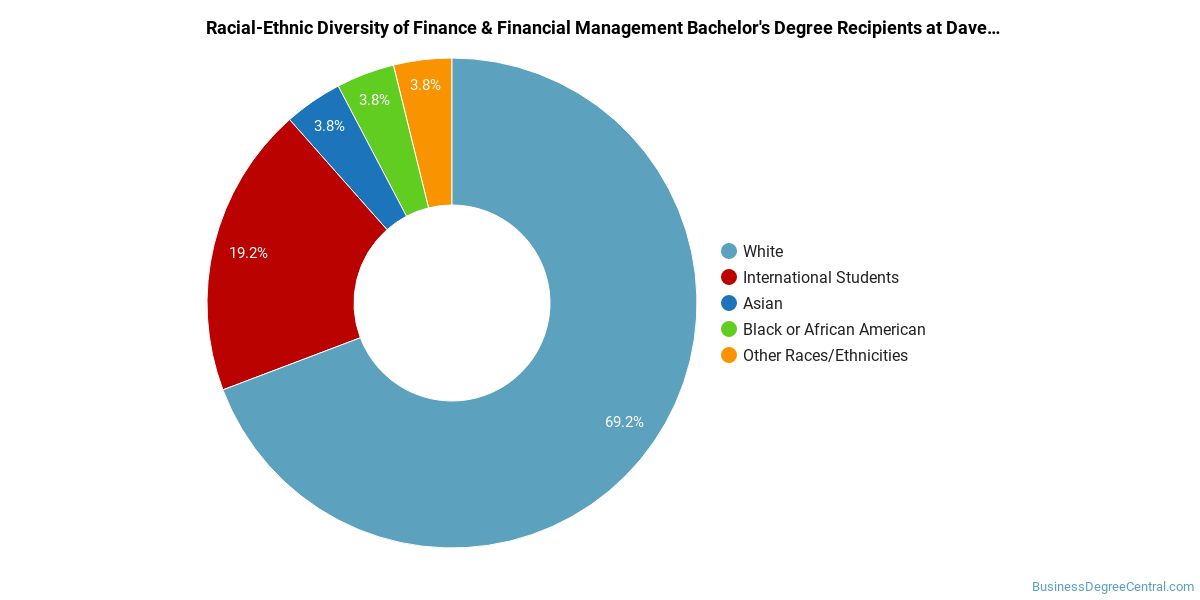
Minority students account for 16% of Finance & Financial Management bachelor’s degree recipients at Davenport University, below the national average of 29%.*
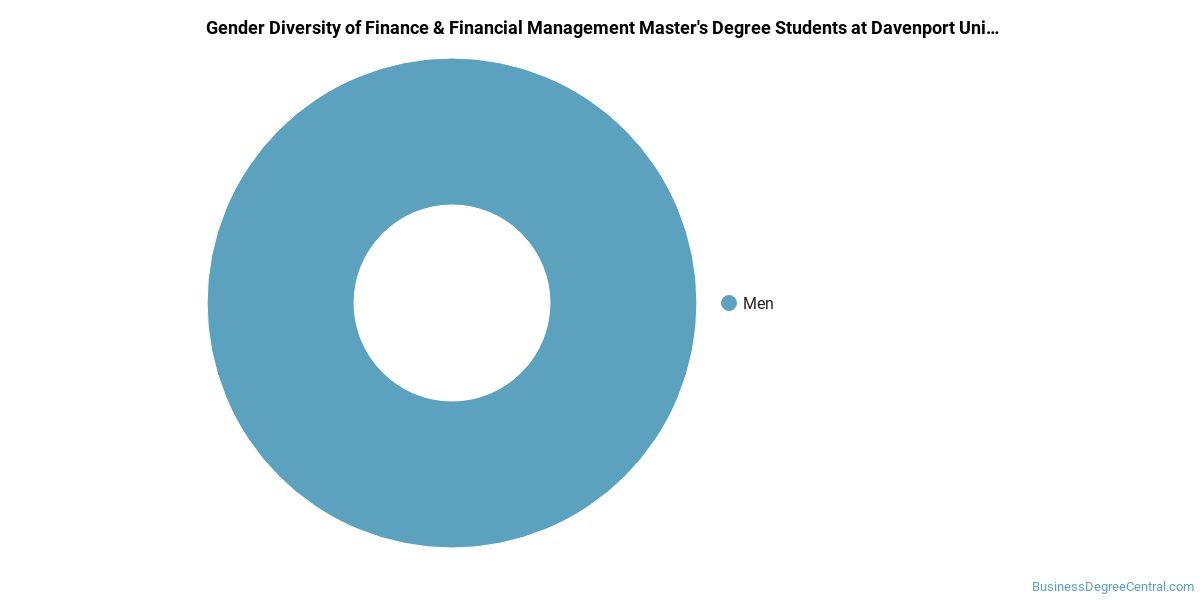
Finance & Financial Management Master’s Program at Davenport University
Of the 3 master’s finance & financial management graduates at Davenport University, 67% were women (2) and 33% were men (1).
The following table and chart show the race/ethnicity of Finance & Financial Management master’s degree recipients at Davenport University.
| Race / Ethnicity | Number of Graduates |
|---|---|
| White | 2 |
| Two or More Races | 1 |

Racial-ethnic minorities make up 33% of Finance & Financial Management master’s degree recipients at Davenport University, above the national average of 27%.*
*The racial-ethnic minorities figure is the total number of graduates minus White, international (nonresident), and unknown-race graduates.
More Specific Finance & Financial Management Concentrations at Davenport University
The Finance & Financial Management program at Davenport University breaks down into more specific concentrations:
| Concentration | Graduates |
|---|---|
| Finance | 44 |
Highest-Paying Careers for Finance & Financial Management Graduates
Students who finish Finance & Financial Management program at Davenport University work across a variety of fields. Here are the highest-paying careers for Finance & Financial Management majors, ordered by median annual salary:
| Occupation | Nationwide Median Wage |
|---|---|
| Treasurers and Controllers | $162,461 |
| Investment Fund Managers | $157,819 |
| General and Operations Managers | $149,694 |
| Chief Executives | $138,534 |
| Insurance Underwriters | $129,939 |
| Financial Risk Specialists | $127,364 |
| Financial Quantitative Analysts | $126,371 |
| Appraisers of Personal and Business Property | $118,242 |
| Chief Sustainability Officers | $96,628 |
| Fraud Examiners, Investigators and Analysts | $92,240 |
References
- IPEDS — Integrated Postsecondary Education Data System
- U.S. Department of Education — College Scorecard
- O*NET Online (Bureau of Labor Statistics)
- National Center for Education Statistics
More about our data sources and methodologies.
BusinessDegreeCentral.com provides higher-education, college and university, degree, program, career, salary, and other helpful information to students, faculty, institutions, and other internet audiences. Presented information and data are subject to change. Inclusion on this website does not imply or represent a direct relationship with the company, school, or brand. Information, though believed correct at time of publication, may not be correct, and no warranty is provided. Contact the schools to verify any information before relying on it. Financial aid may be available for those who qualify. The displayed options may include sponsored or recommended results, not necessarily based on your preferences.
© BusinessDegreeCentral.com – All Rights Reserved.