Business Administration & Management at Westcliff University
What traits are you looking for in a school for Business Administration & Management, take a look at what Westcliff University. The following information will help you decide if it is a good fit for you.
Westcliff University is located in Irvine, CA.
For the most recent IPEDS reporting year, 505 business administration & management graduations were recorded at Westcliff University.
Featured schools near , edit
Online Class Availability at Westcliff University
Online coursework is an option at Westcliff University. Among 7,686 students, 2,520 (33%) studied exclusively online and 381 (5%) took at least some classes online.
Student Demographics & Diversity
The following sections describe the student demographics for Business Administration & Management graduates at Westcliff University, by degree type.
Looking at the program as a whole, Business Administration & Management graduates at Westcliff University are 42% women (213) and 58% men (292).
Business Administration & Management Bachelor’s Program at Westcliff University
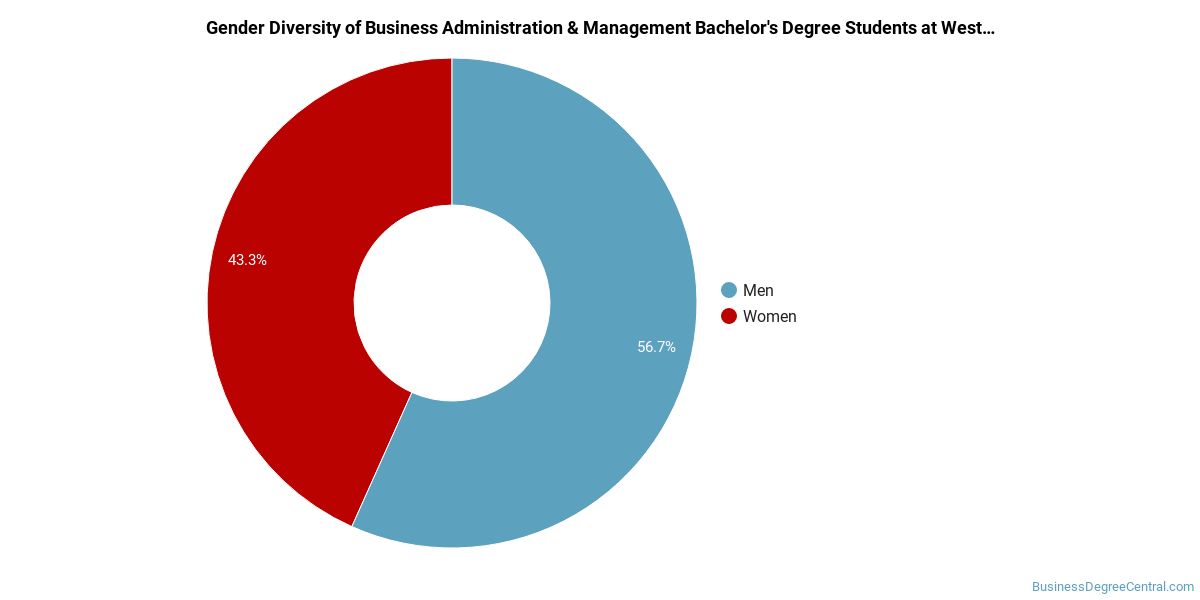
Among the 224 bachelor’s business administration & management graduates at Westcliff University, 38% were women (85) and 62% were men (139).
The following table and chart show the race/ethnicity of Business Administration & Management bachelor’s degree recipients at Westcliff University.
| Race / Ethnicity | Number of Graduates |
|---|---|
| White | 25 |
| Hispanic / Latino | 5 |
| Black / African American | 7 |
| Asian | 2 |
| Native Hawaiian / Pacific Islander | 2 |
| Two or More Races | 4 |
| International (Nonresident) | 23 |
| Unknown | 156 |
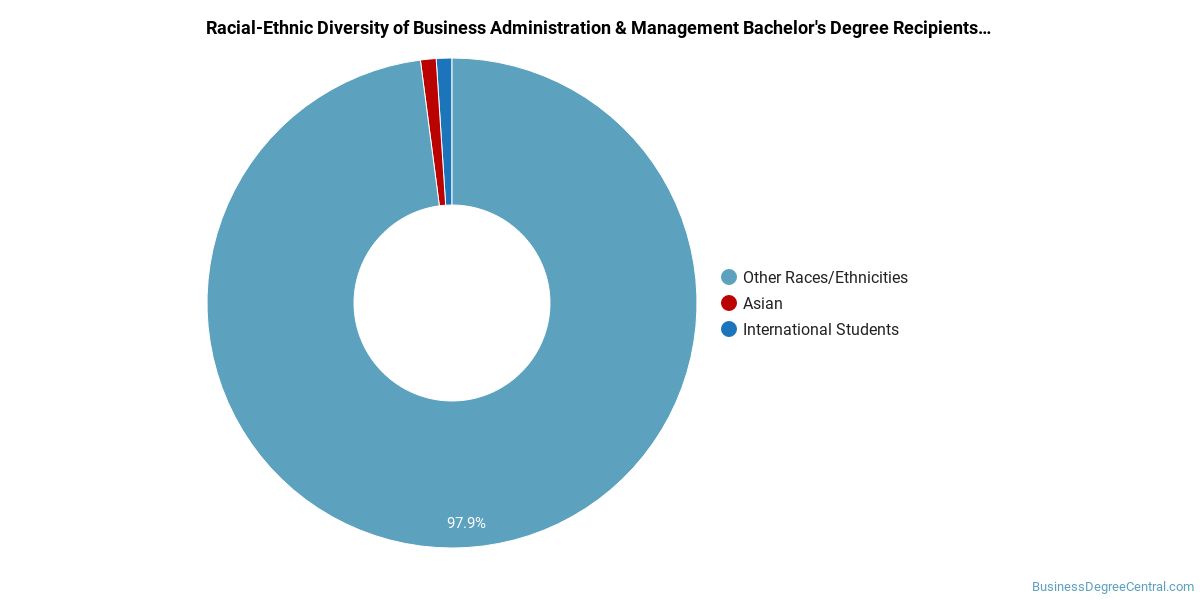
Racial-ethnic minorities make up 9% of Business Administration & Management bachelor’s degree recipients at Westcliff University, lower than the national average of 41%.*
Business Administration & Management Master’s Program at Westcliff University
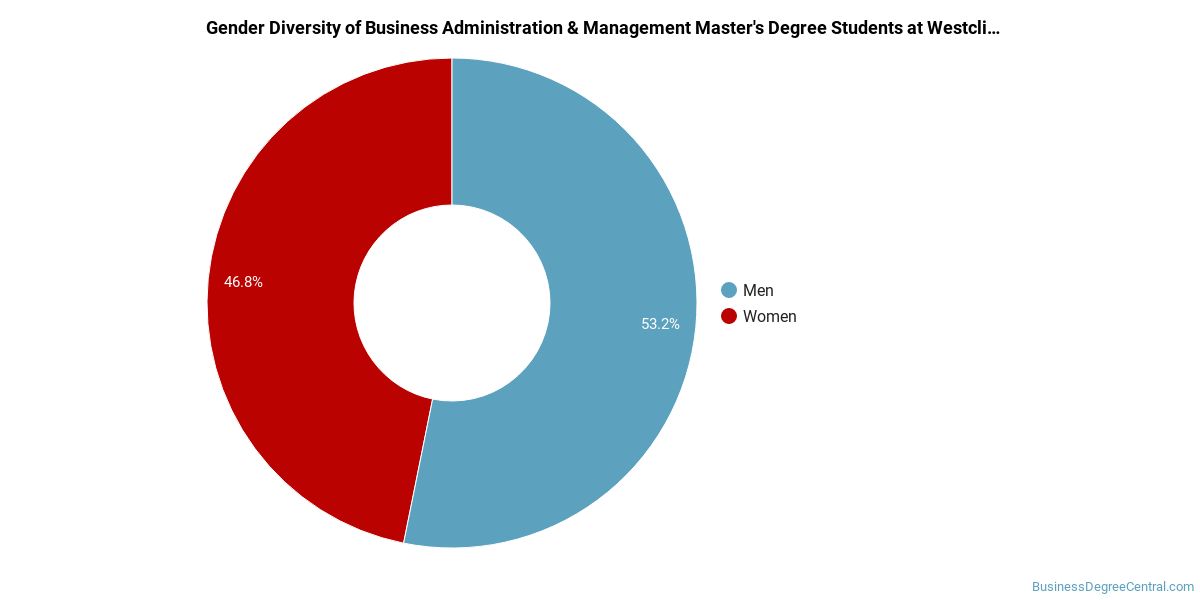
Of the 245 master’s business administration & management graduates at Westcliff University, 47% were women (114) and 53% were men (131).
The following table and chart show the race/ethnicity of Business Administration & Management master’s degree recipients at Westcliff University.
| Race / Ethnicity | Number of Graduates |
|---|---|
| White | 6 |
| Hispanic / Latino | 1 |
| Black / African American | 1 |
| Asian | 4 |
| Two or More Races | 2 |
| International (Nonresident) | 93 |
| Unknown | 138 |
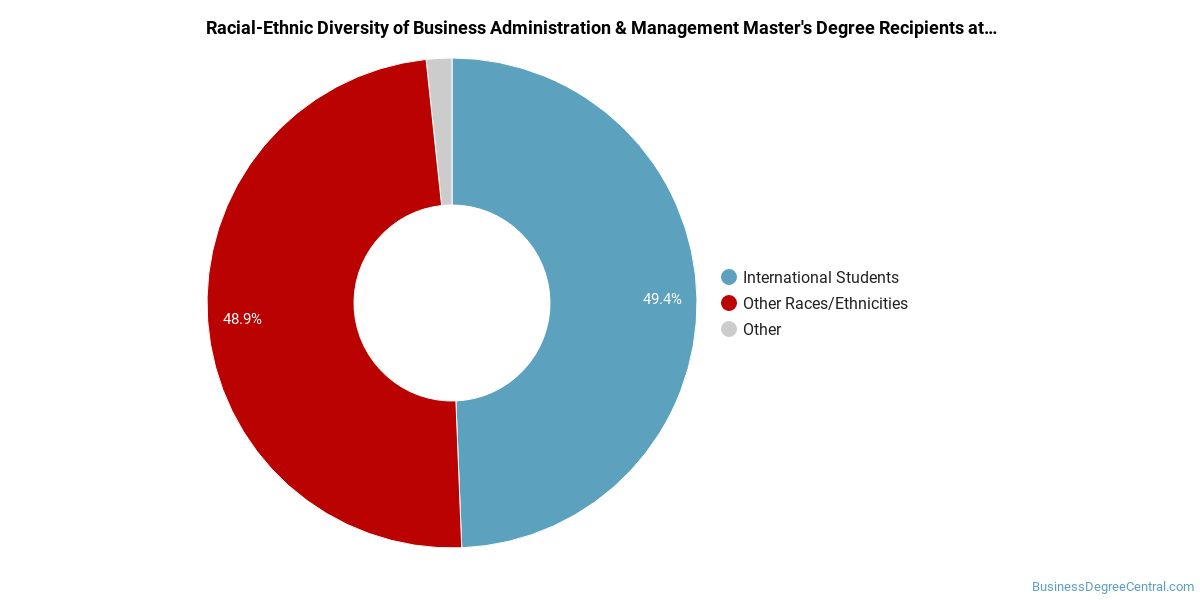
Minority students account for 3% of Business Administration & Management master’s degree recipients at Westcliff University, below the national average of 36%.*
Business Administration & Management Doctoral Program at Westcliff University
Of the 34 doctoral business administration & management degrees awarded at Westcliff University, 38% were women (13) and 62% were men (21).

The following table and chart show the race/ethnicity of Business Administration & Management doctoral degree recipients at Westcliff University.
| Race / Ethnicity | Number of Graduates |
|---|---|
| White | 1 |
| Black / African American | 1 |
| American Indian / Alaska Native | 1 |
| International (Nonresident) | 20 |
| Unknown | 11 |

Racial-ethnic minorities make up 6% of Business Administration & Management doctoral degree recipients at Westcliff University, below the national average of 44%.*
*The racial-ethnic minorities figure is the total number of graduates minus White, international (nonresident), and unknown-race graduates.
More Specific Business Administration & Management Concentrations at Westcliff University
The Business Administration & Management program at Westcliff University offers more specialized concentrations:
| Concentration | Graduates |
|---|---|
| Business Administration & Management | 494 |
| Supply Chain Management | 3 |
| Non-Profit Organizational Management | 4 |
| E-Commerce | 3 |
| Organizational Leadership | 1 |
Top-Paying Careers for Business Administration & Management Graduates
Graduates of the Business Administration & Management program at Westcliff University work across a variety of fields. Here are the best-paid careers for Business Administration & Management majors, ordered by median annual salary:
| Occupation | Nationwide Median Wage |
|---|---|
| Loss Prevention Managers | $165,723 |
| Geothermal Production Managers | $160,381 |
| Administrative Services Managers | $158,084 |
| Facilities Managers | $157,669 |
| Biomass Power Plant Managers | $146,025 |
| Supply Chain Managers | $138,103 |
| Medical and Health Services Managers | $129,557 |
| Security Management Specialists | $128,654 |
| Industrial Production Managers | $126,666 |
| Wind Energy Operations Managers | $122,567 |
References
- IPEDS — Integrated Postsecondary Education Data System
- U.S. Department of Education — College Scorecard
- O*NET Online (Bureau of Labor Statistics)
- National Center for Education Statistics
More about our data sources and methodologies.
BusinessDegreeCentral.com provides higher-education, college and university, degree, program, career, salary, and other helpful information to students, faculty, institutions, and other internet audiences. Presented information and data are subject to change. Inclusion on this website does not imply or represent a direct relationship with the company, school, or brand. Information, though believed correct at time of publication, may not be correct, and no warranty is provided. Contact the schools to verify any information before relying on it. Financial aid may be available for those who qualify. The displayed options may include sponsored or recommended results, not necessarily based on your preferences.
© BusinessDegreeCentral.com – All Rights Reserved.