Business Administration & Management at University of the People
What traits are you looking for in a school for Business Administration & Management, consider the program at University of the People. We’ve gathered the following information to help you decide.
University of the People sits in Pasadena, CA.
During the most recent reporting year, 3,292 business administration & management degrees were awarded at University of the People.
Featured schools near , edit
Studying Online at University of the People
University of the People is a fully online institution, so Business Administration & Management coursework can be completed remotely.
Student Demographics & Diversity
The following sections describe the composition of Business Administration & Management graduates at University of the People, broken down by degree level.
Program-wide, Business Administration & Management graduates at University of the People are 45% women (1,481) and 55% men (1,811).
Business Administration & Management Associate’s Program at University of the People
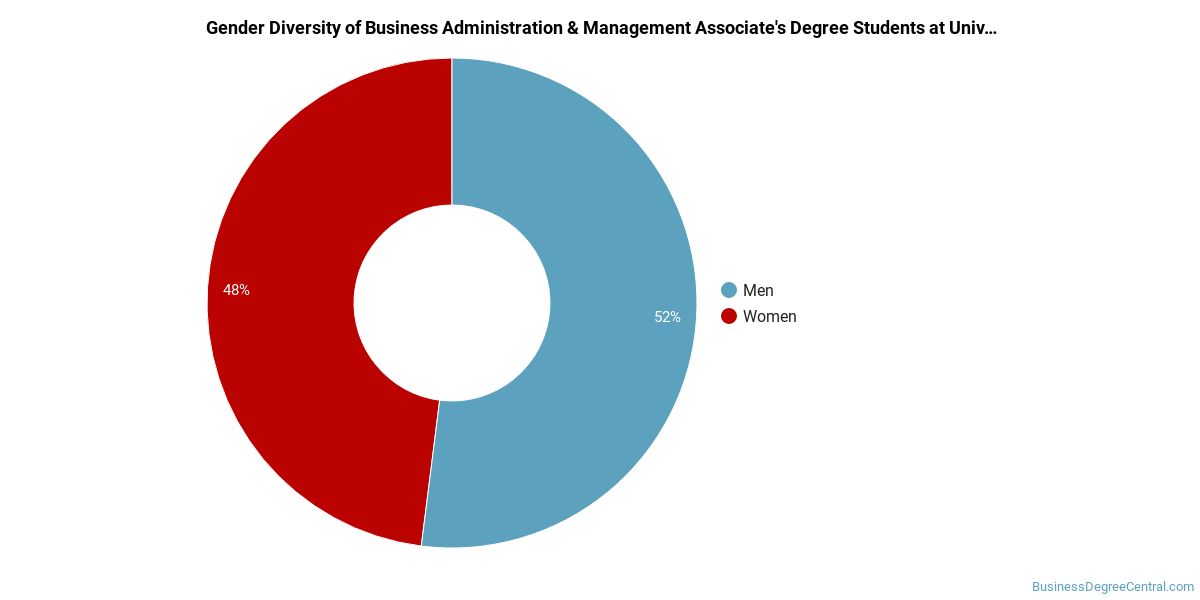
Among the 1,359 associate’s business administration & management degrees awarded at University of the People, 51% were women (688) and 49% were men (671).
The following table and chart show the race/ethnicity of Business Administration & Management associate’s degree recipients at University of the People.
| Race / Ethnicity | Number of Graduates |
|---|---|
| White | 43 |
| Hispanic / Latino | 14 |
| Black / African American | 23 |
| Asian | 8 |
| American Indian / Alaska Native | 1 |
| Two or More Races | 5 |
| Unknown | 1,265 |
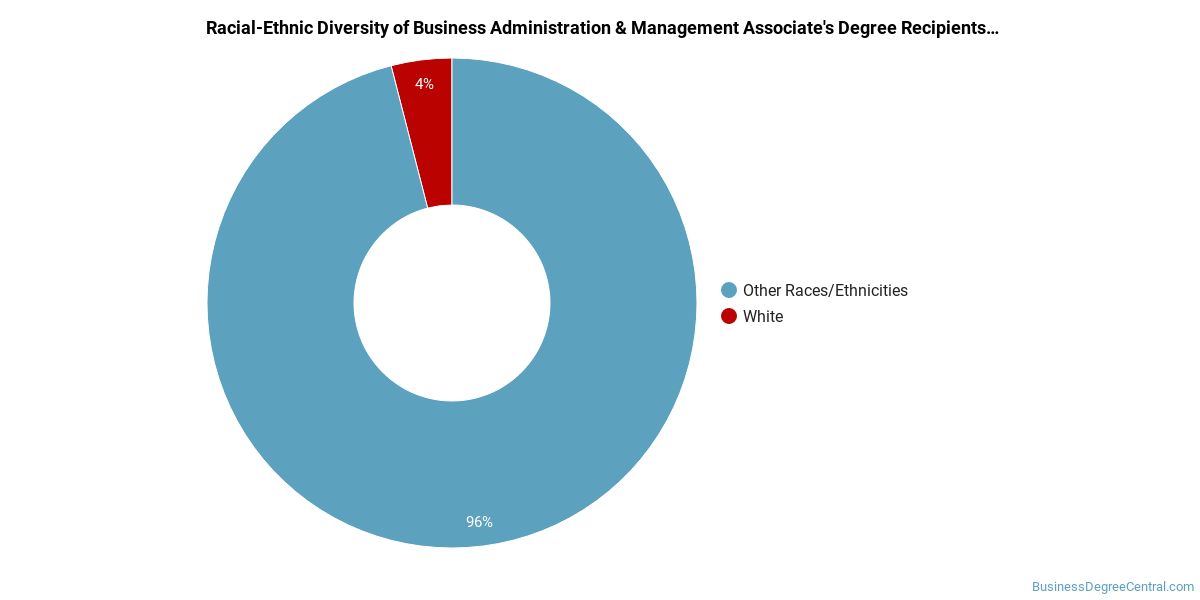
Racial-ethnic minorities make up 4% of Business Administration & Management associate’s degree recipients at University of the People, lower than the national average of 51%.*
Business Administration & Management Bachelor’s Program at University of the People
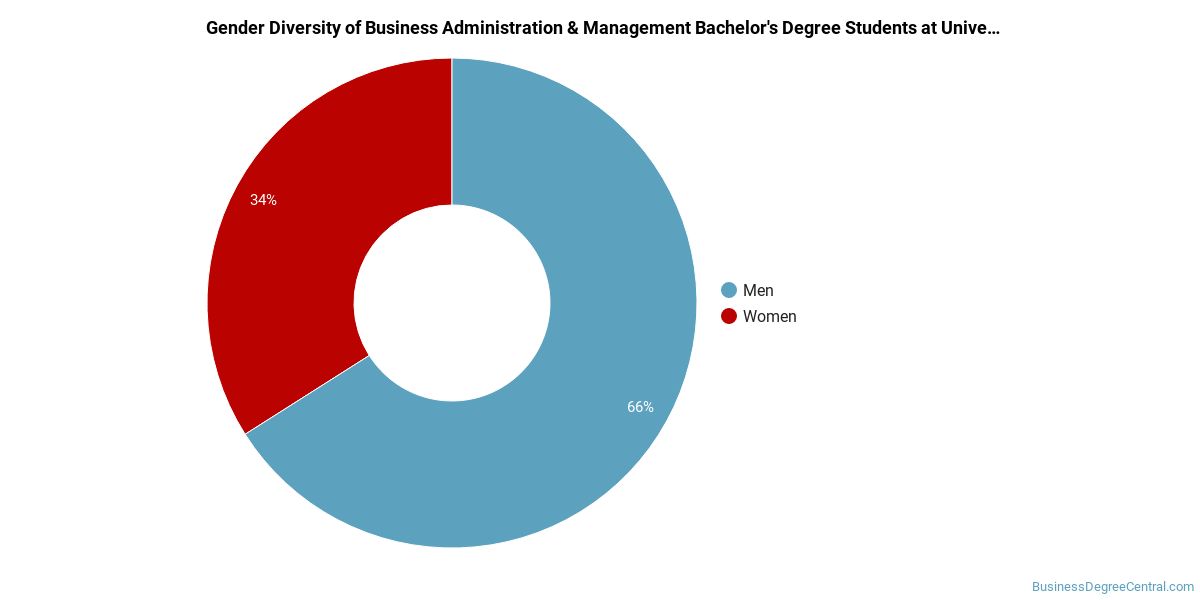
Among the 660 bachelor’s business administration & management degrees awarded at University of the People, 44% were women (292) and 56% were men (368).
The following table and chart show the race/ethnicity of Business Administration & Management bachelor’s degree recipients at University of the People.
| Race / Ethnicity | Number of Graduates |
|---|---|
| White | 53 |
| Hispanic / Latino | 33 |
| Black / African American | 18 |
| Asian | 22 |
| American Indian / Alaska Native | 3 |
| Native Hawaiian / Pacific Islander | 1 |
| Two or More Races | 5 |
| Unknown | 525 |
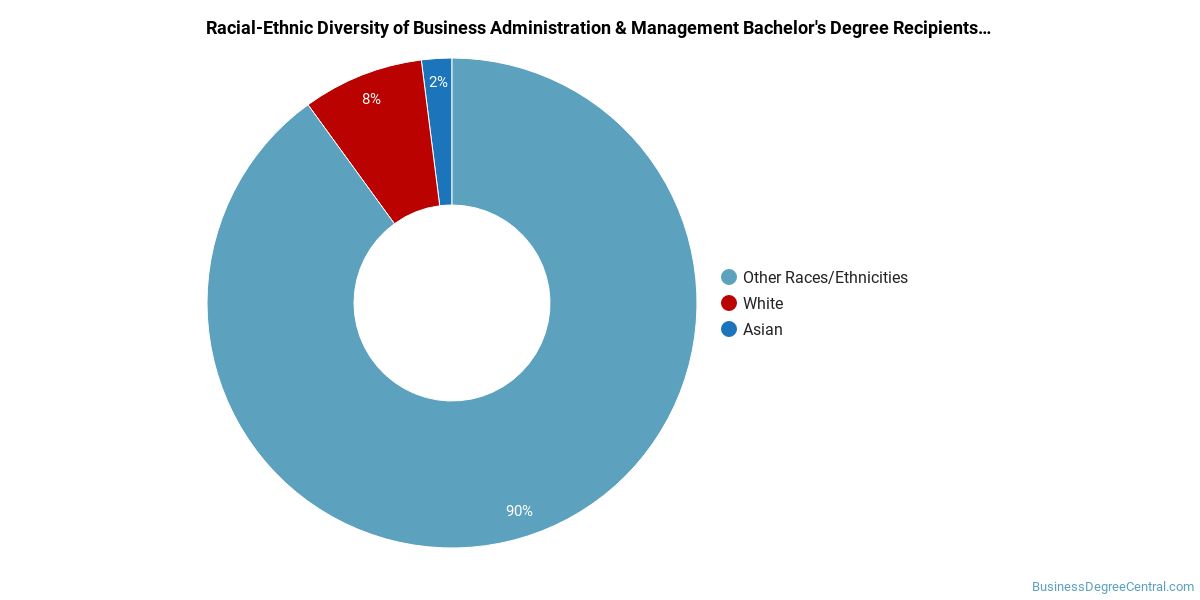
Racial-ethnic minorities make up 12% of Business Administration & Management bachelor’s degree recipients at University of the People, lower than the national average of 41%.*
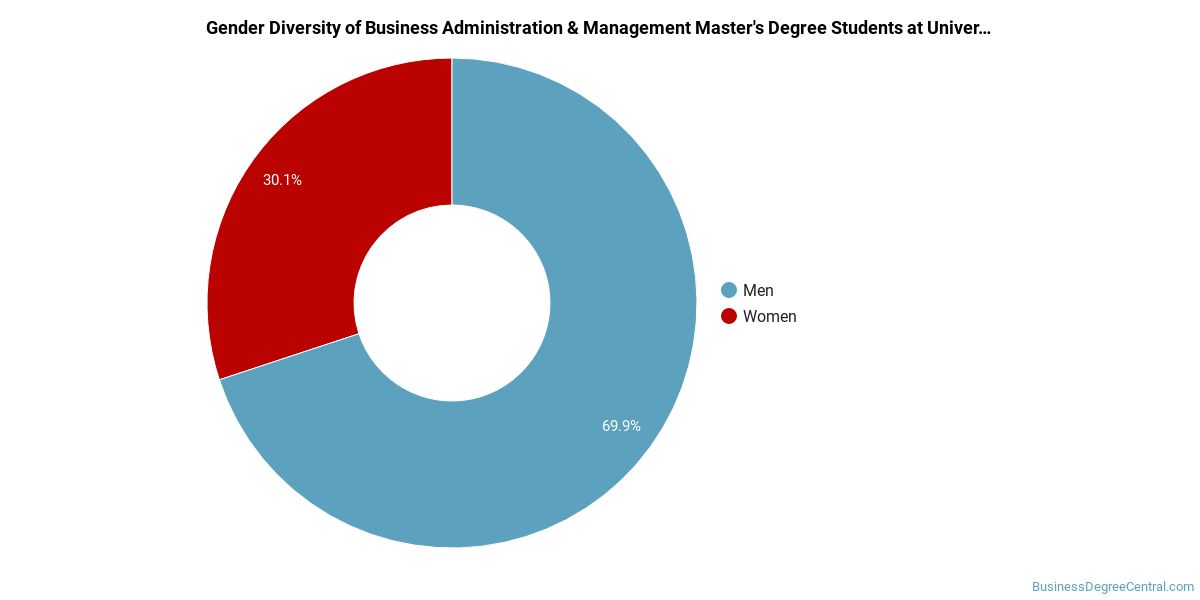
Business Administration & Management Master’s Program at University of the People
Among the 1,231 master’s business administration & management graduates at University of the People, 39% were women (478) and 61% were men (753).
The following table and chart show the race/ethnicity of Business Administration & Management master’s degree recipients at University of the People.
| Race / Ethnicity | Number of Graduates |
|---|---|
| White | 100 |
| Hispanic / Latino | 52 |
| Black / African American | 73 |
| Asian | 59 |
| American Indian / Alaska Native | 1 |
| Native Hawaiian / Pacific Islander | 2 |
| Two or More Races | 5 |
| Unknown | 939 |
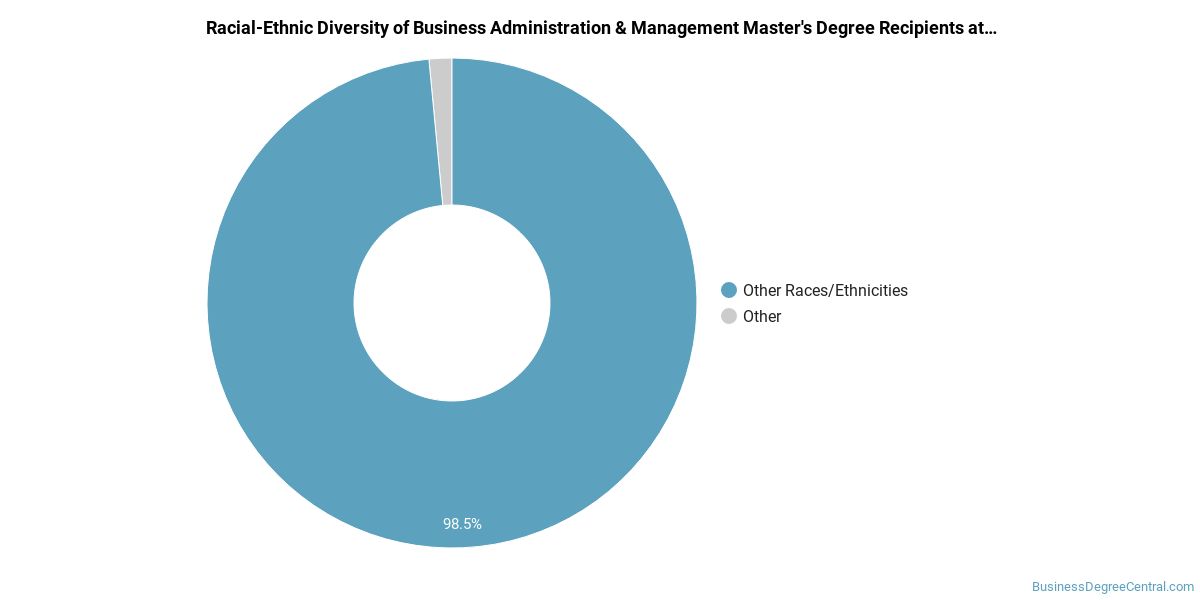
Racial-ethnic minorities make up 16% of Business Administration & Management master’s degree recipients at University of the People, below the national average of 36%.*
*The racial-ethnic minorities figure is the total number of graduates minus White, international (nonresident), and unknown-race graduates.
More Specific Business Administration & Management Concentrations at University of the People
This Business Administration & Management program at University of the People includes the following sub-specializations:
| Concentration | Graduates |
|---|---|
| Business Administration & Management | 3,292 |
Best-Paid Careers for Business Administration & Management Graduates
Graduates of the Business Administration & Management program at University of the People work across a variety of fields. The table below ranks the top-paying careers for Business Administration & Management majors, ordered by median annual salary:
| Occupation | Nationwide Median Wage |
|---|---|
| Loss Prevention Managers | $165,723 |
| Geothermal Production Managers | $160,381 |
| Administrative Services Managers | $158,084 |
| Facilities Managers | $157,669 |
| Biomass Power Plant Managers | $146,025 |
| Supply Chain Managers | $138,103 |
| Medical and Health Services Managers | $129,557 |
| Security Management Specialists | $128,654 |
| Industrial Production Managers | $126,666 |
| Wind Energy Operations Managers | $122,567 |
References
- IPEDS — Integrated Postsecondary Education Data System
- U.S. Department of Education — College Scorecard
- O*NET Online (Bureau of Labor Statistics)
- National Center for Education Statistics
More about our data sources and methodologies.
BusinessDegreeCentral.com provides higher-education, college and university, degree, program, career, salary, and other helpful information to students, faculty, institutions, and other internet audiences. Presented information and data are subject to change. Inclusion on this website does not imply or represent a direct relationship with the company, school, or brand. Information, though believed correct at time of publication, may not be correct, and no warranty is provided. Contact the schools to verify any information before relying on it. Financial aid may be available for those who qualify. The displayed options may include sponsored or recommended results, not necessarily based on your preferences.
© BusinessDegreeCentral.com – All Rights Reserved.