Finance at University of Nevada-Reno
If you plan to study Finance, take a look at what University of Nevada-Reno. Get started with the following essential facts.
University of Nevada-Reno is located in Reno, NV.
In the most recent year for which we have data, 157 finance degrees were awarded at University of Nevada-Reno.
Featured schools near , edit
Online & Distance Learning at University of Nevada-Reno
Many students take online classes at University of Nevada-Reno. Among 23,024 students, 1,483 (6%) studied exclusively online and 6,208 (27%) took at least some classes online.
Finance Rankings at University of Nevada-Reno
Use these rankings to compare University of Nevada-Reno’s Finance program against peer institutions.
Bachelor’s-Level Rankings
| Ranking | Scope | Rank |
|---|---|---|
| Best Schools (Quality) | Nevada | #1 of 2 |
| Best Value | Nevada | #2 of 2 |
| Best Value | Far Western (Region) | #10 of 29 |
| Best Schools (Quality) | Far Western (Region) | #15 of 27 |
| Best Value | Nationwide | #135 of 532 |
| Best Schools (Quality) | Nationwide | #167 of 525 |
Master’s-Level Rankings
| Ranking | Scope | Rank |
|---|---|---|
| Best Schools (Quality) | Nevada | #1 of 2 |
| Best Value | Nevada | #2 of 2 |
| Best Value | Far Western (Region) | #10 of 29 |
| Best Schools (Quality) | Far Western (Region) | #15 of 27 |
| Best Value | Nationwide | #135 of 532 |
| Best Schools (Quality) | Nationwide | #167 of 525 |
Student Demographics & Diversity
Take a look at the composition of Finance graduates at University of Nevada-Reno, broken down by degree level.
Program-wide, Finance graduates at University of Nevada-Reno are 22% women (34) and 78% men (123).
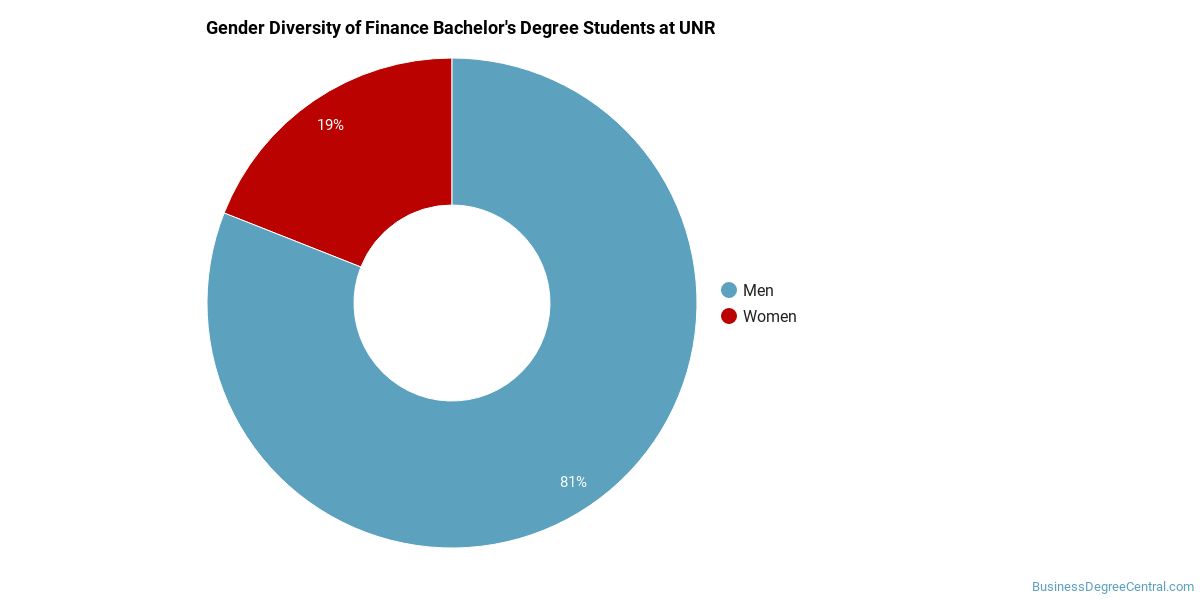
Finance Bachelor’s Program at University of Nevada-Reno
Among the 146 bachelor’s finance degrees awarded at University of Nevada-Reno, 21% were women (30) and 79% were men (116).
The following table and chart show the race/ethnicity of Finance bachelor’s degree recipients at University of Nevada-Reno.
| Race / Ethnicity | Number of Graduates |
|---|---|
| White | 85 |
| Hispanic / Latino | 28 |
| Black / African American | 3 |
| Asian | 14 |
| American Indian / Alaska Native | 2 |
| Two or More Races | 10 |
| International (Nonresident) | 4 |
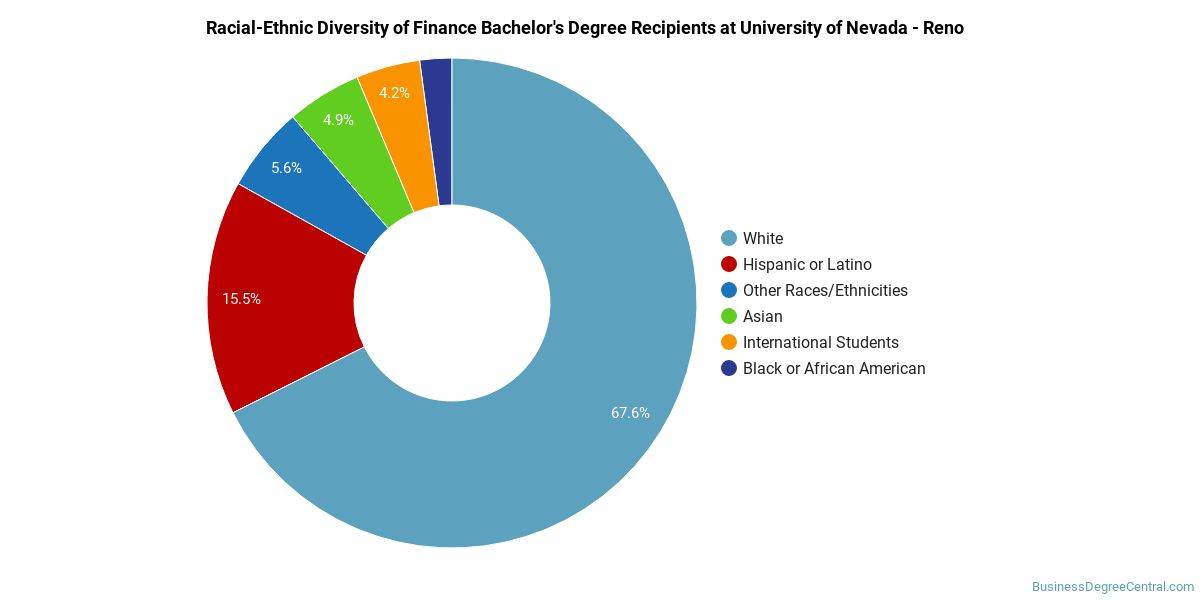
Minority students account for 39% of Finance bachelor’s degree recipients at University of Nevada-Reno, higher than the national average of 29%.*
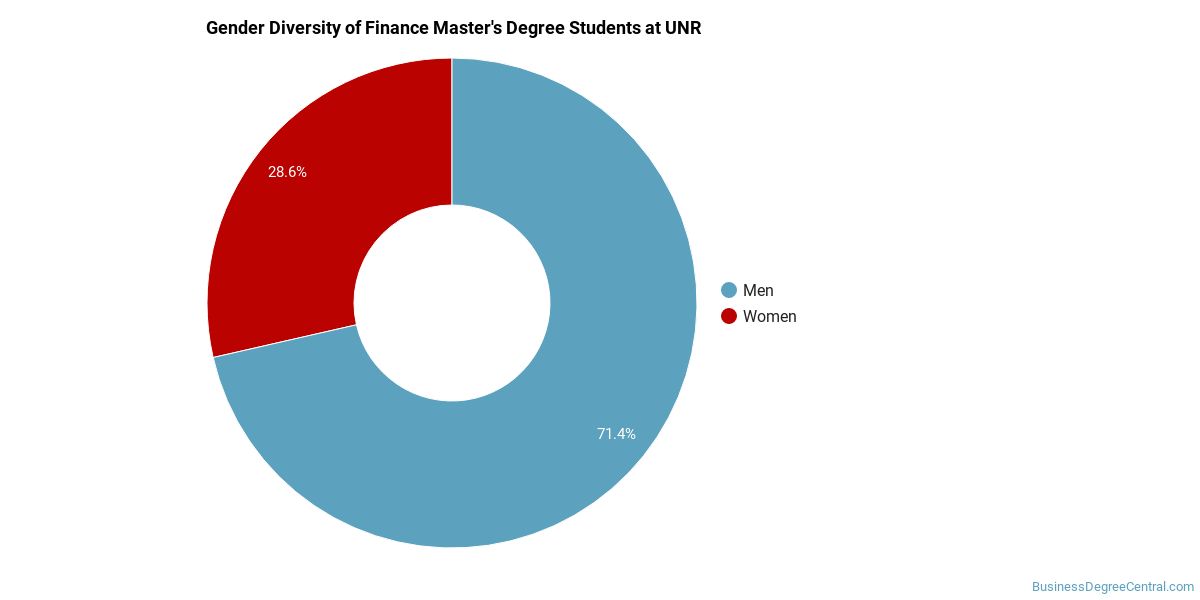
Finance Master’s Program at University of Nevada-Reno
Among the 11 master’s finance graduates at University of Nevada-Reno, 36% were women (4) and 64% were men (7).
The following table and chart show the race/ethnicity of Finance master’s degree recipients at University of Nevada-Reno.
| Race / Ethnicity | Number of Graduates |
|---|---|
| White | 6 |
| Two or More Races | 1 |
| International (Nonresident) | 4 |
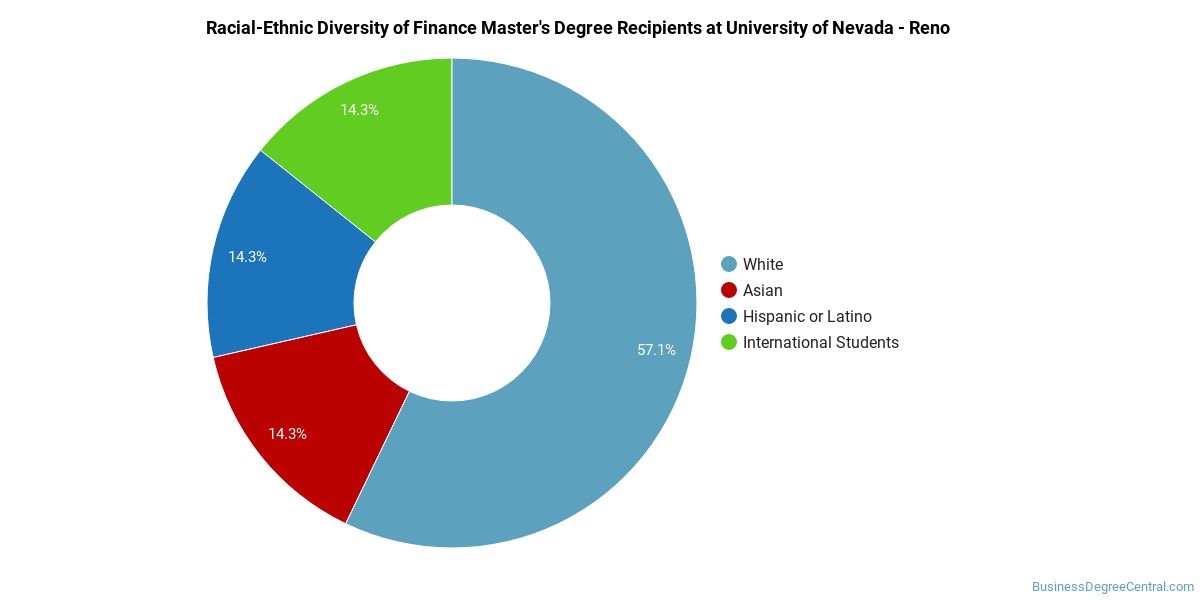
Racial-ethnic minorities make up 9% of Finance master’s degree recipients at University of Nevada-Reno, below the national average of 28%.*
*The racial-ethnic minorities figure is the total number of graduates minus White, international (nonresident), and unknown-race graduates.
Top-Paying Careers for Finance Graduates
Students who finish Finance program at University of Nevada-Reno go on to a range of careers. The table below ranks the highest-paying careers for Finance graduates, ordered by median annual salary:
| Occupation | Nationwide Median Wage |
|---|---|
| Treasurers and Controllers | $162,461 |
| Investment Fund Managers | $157,819 |
| General and Operations Managers | $149,694 |
| Chief Executives | $138,534 |
| Financial Risk Specialists | $127,364 |
| Financial Quantitative Analysts | $126,371 |
| Appraisers of Personal and Business Property | $118,242 |
| Chief Sustainability Officers | $96,628 |
| Fraud Examiners, Investigators and Analysts | $92,240 |
| Personal Financial Advisors | $91,777 |
References
- IPEDS — Integrated Postsecondary Education Data System
- U.S. Department of Education — College Scorecard
- O*NET Online (Bureau of Labor Statistics)
- National Center for Education Statistics
More about our data sources and methodologies.
BusinessDegreeCentral.com provides higher-education, college and university, degree, program, career, salary, and other helpful information to students, faculty, institutions, and other internet audiences. Presented information and data are subject to change. Inclusion on this website does not imply or represent a direct relationship with the company, school, or brand. Information, though believed correct at time of publication, may not be correct, and no warranty is provided. Contact the schools to verify any information before relying on it. Financial aid may be available for those who qualify. The displayed options may include sponsored or recommended results, not necessarily based on your preferences.
© BusinessDegreeCentral.com – All Rights Reserved.