Operations Management at University of Cincinnati-Main Campus
What traits are you looking for in a school for Operations Management, take a look at what University of Cincinnati-Main Campus. Get started with the following essential facts.
University of Cincinnati-Main Campus is located in Cincinnati, OH.
In the most recent year for which we have data, 152 operations management degrees were granted at University of Cincinnati-Main Campus.
Featured schools near , edit
Online & Distance Learning at University of Cincinnati-Main Campus
Distance learning is available at University of Cincinnati-Main Campus. Among 45,026 students, 9,022 (20%) were enrolled entirely in distance education and 19,145 (43%) took at least some classes online.
Operations Management Rankings at University of Cincinnati-Main Campus
Use these rankings to compare University of Cincinnati-Main Campus’s Operations Management program to other colleges that offer this major.
Bachelor’s-Level Rankings
| Ranking | Scope | Rank |
|---|---|---|
| Best Schools (Quality) | Ohio | #3 of 8 |
| Best Schools (Quality) | Great Lakes (Region) | #6 of 27 |
| Best Schools (Quality) | Nationwide | #10 of 79 |
| Best Value | Ohio | #11 of 15 |
| Best Value | Great Lakes (Region) | #46 of 57 |
| Best Value | Nationwide | #171 of 205 |
Student Demographics & Diversity
Take a look at the composition of Operations Management graduates at University of Cincinnati-Main Campus, broken down by degree level.
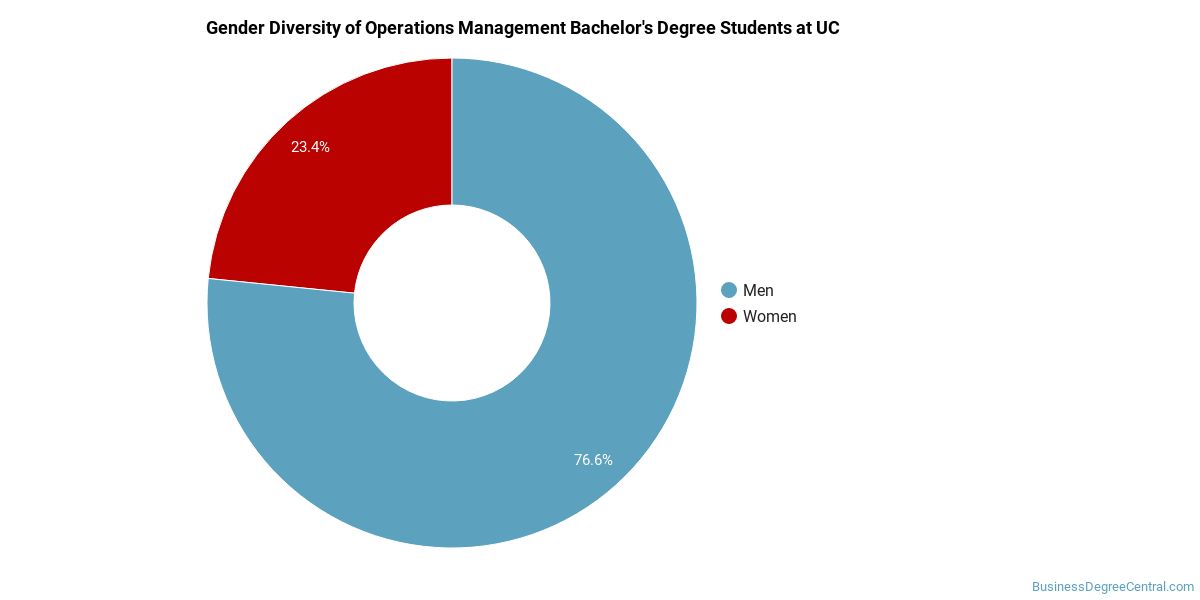
Program-wide, Operations Management graduates at University of Cincinnati-Main Campus are 32% women (48) and 68% men (104).
Operations Management Bachelor’s Program at University of Cincinnati-Main Campus
Among the 152 bachelor’s operations management graduates at University of Cincinnati-Main Campus, 32% were women (48) and 68% were men (104).
The following table and chart show the race/ethnicity of Operations Management bachelor’s degree recipients at University of Cincinnati-Main Campus.
| Race / Ethnicity | Number of Graduates |
|---|---|
| White | 125 |
| Hispanic / Latino | 6 |
| Black / African American | 5 |
| Asian | 5 |
| Native Hawaiian / Pacific Islander | 1 |
| Two or More Races | 5 |
| International (Nonresident) | 5 |
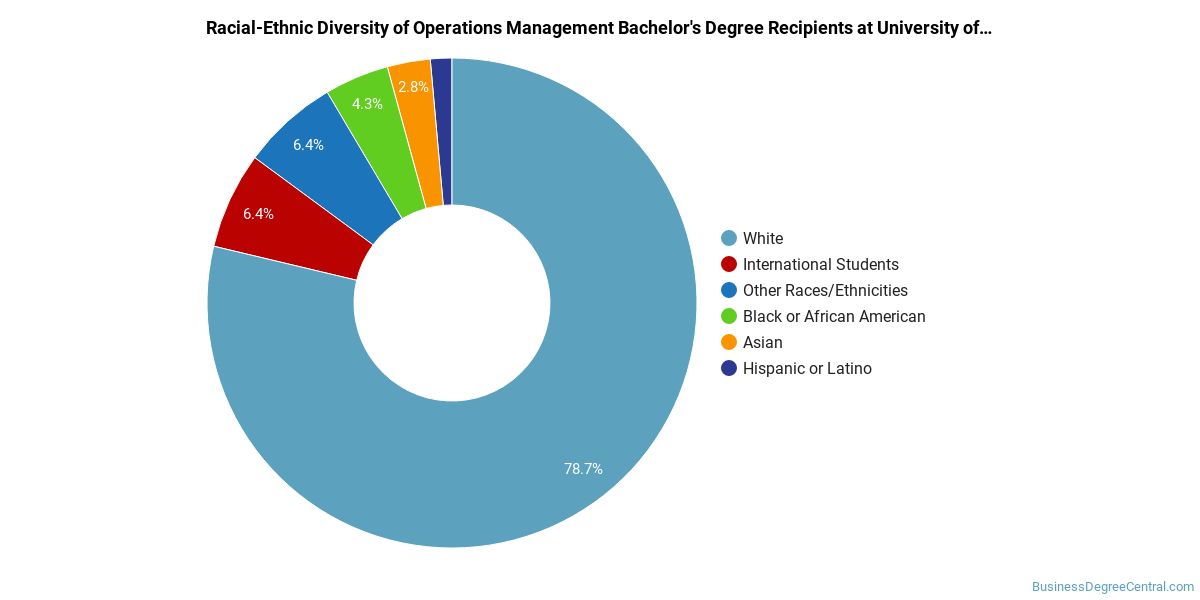
Minority students account for 14% of Operations Management bachelor’s degree recipients at University of Cincinnati-Main Campus, below the national average of 26%.*
*The racial-ethnic minorities figure is the total number of graduates minus White, international (nonresident), and unknown-race graduates.
Best-Paid Careers for Operations Management Graduates
Students who finish Operations Management program at University of Cincinnati-Main Campus go on to a range of careers. The table below ranks the best-paid careers for Operations Management graduates, ordered by median annual salary:
| Occupation | Nationwide Median Wage |
|---|---|
| Computer and Information Systems Managers | $175,079 |
| Biofuels Production Managers | $164,096 |
| Geothermal Production Managers | $160,381 |
| Facilities Managers | $157,669 |
| Biomass Power Plant Managers | $146,025 |
| Industrial Production Managers | $126,666 |
| Quality Control Systems Managers | $108,531 |
| Security Managers | $104,128 |
| Hydroelectric Production Managers | $91,208 |
| Construction Managers | $83,791 |
References
- IPEDS — Integrated Postsecondary Education Data System
- U.S. Department of Education — College Scorecard
- O*NET Online (Bureau of Labor Statistics)
- National Center for Education Statistics
More about our data sources and methodologies.
BusinessDegreeCentral.com provides higher-education, college and university, degree, program, career, salary, and other helpful information to students, faculty, institutions, and other internet audiences. Presented information and data are subject to change. Inclusion on this website does not imply or represent a direct relationship with the company, school, or brand. Information, though believed correct at time of publication, may not be correct, and no warranty is provided. Contact the schools to verify any information before relying on it. Financial aid may be available for those who qualify. The displayed options may include sponsored or recommended results, not necessarily based on your preferences.
© BusinessDegreeCentral.com – All Rights Reserved.