Business Administration & Management at Sullivan University
What traits are you looking for in a school for Business Administration & Management, consider the program at Sullivan University. Get started with the following essential facts.
Sullivan University is in Louisville, KY.
In the most recent year for which we have data, 124 business administration & management degrees were awarded at Sullivan University.
Featured schools near , edit
Studying Online at Sullivan University
Online coursework is an option at Sullivan University. Among 2,498 students, 1,243 (50%) studied exclusively online and 385 (15%) took at least some classes online.
Business Administration & Management Rankings at Sullivan University
Use these rankings to compare Sullivan University’s Business Administration & Management program against other schools offering the same major.
Bachelor’s-Level Rankings
| Ranking | Scope | Rank |
|---|---|---|
| Best Schools (Quality) | Kentucky | #29 of 37 |
| Best Value | Kentucky | #37 of 37 |
| Best Schools (Quality) | Southeast (Region) | #388 of 535 |
| Best Value | Southeast (Region) | #476 of 530 |
| Best Schools (Quality) | Nationwide | #1663 of 2,012 |
| Best Value | Nationwide | #1717 of 1,983 |
Master’s-Level Rankings
| Ranking | Scope | Rank |
|---|---|---|
| Best Schools (Quality) | Kentucky | #29 of 37 |
| Best Value | Kentucky | #37 of 37 |
| Best Schools (Quality) | Southeast (Region) | #388 of 535 |
| Best Value | Southeast (Region) | #476 of 530 |
| Best Schools (Quality) | Nationwide | #1663 of 2,012 |
| Best Value | Nationwide | #1717 of 1,983 |
Doctoral-Level Rankings
| Ranking | Scope | Rank |
|---|---|---|
| Best Schools (Quality) | Kentucky | #29 of 37 |
| Best Value | Kentucky | #37 of 37 |
| Best Schools (Quality) | Southeast (Region) | #388 of 535 |
| Best Value | Southeast (Region) | #476 of 530 |
| Best Schools (Quality) | Nationwide | #1663 of 2,012 |
| Best Value | Nationwide | #1717 of 1,983 |
Associate-Level Rankings
| Ranking | Scope | Rank |
|---|---|---|
| Best Schools (Quality) | Kentucky | #29 of 37 |
| Best Value | Kentucky | #37 of 37 |
| Best Schools (Quality) | Southeast (Region) | #388 of 535 |
| Best Value | Southeast (Region) | #476 of 530 |
| Best Schools (Quality) | Nationwide | #1663 of 2,012 |
| Best Value | Nationwide | #1717 of 1,983 |
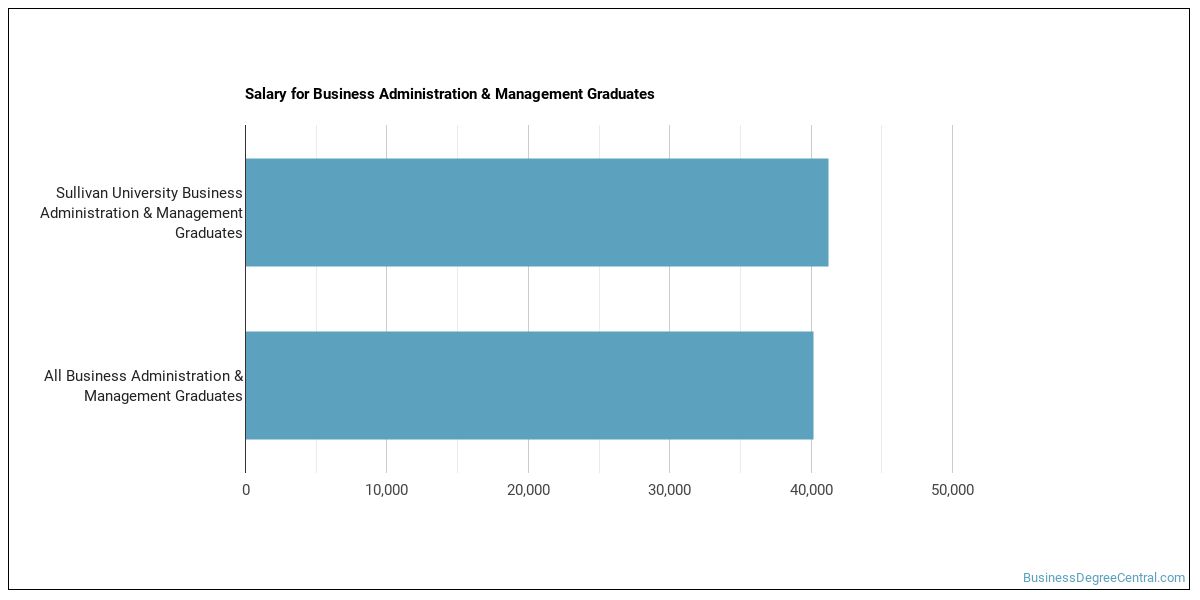
Earnings for Business Administration & Management Graduates from Sullivan University
Those who finish Sullivan University’s Business Administration & Management program report the following median earnings (per the U.S. Department of Education’s College Scorecard):
| Years After Graduation | Median Earnings |
|---|---|
| 1 year | $47,935 |
| 2 years | $44,431 |
| 3 years | $48,324 |
| 4 years | $57,188 |
| 5 years | $63,796 |
How do these earnings stack up against the rest of the school? Four years after graduating, Business Administration & Management graduates from Sullivan University report median earnings of $57,188, compared with $62,604 for all Sullivan University graduates — about 9% lower than the school-wide median.

Median Debt at Graduation
Typical debt at graduation for Business Administration & Management graduates from Sullivan University comes in at $37,118.
Student Demographics & Diversity
The following sections describe the composition of Business Administration & Management graduates at Sullivan University, by degree type.
Program-wide, Business Administration & Management graduates at Sullivan University are 60% women (74) and 40% men (50).
Business Administration & Management Associate’s Program at Sullivan University
Of the 25 associate’s business administration & management degrees awarded at Sullivan University, 68% were women (17) and 32% were men (8).

The following table and chart show the race/ethnicity of Business Administration & Management associate’s degree recipients at Sullivan University.
| Race / Ethnicity | Number of Graduates |
|---|---|
| White | 15 |
| Hispanic / Latino | 2 |
| Black / African American | 5 |
| Native Hawaiian / Pacific Islander | 1 |
| Two or More Races | 1 |
| Unknown | 1 |
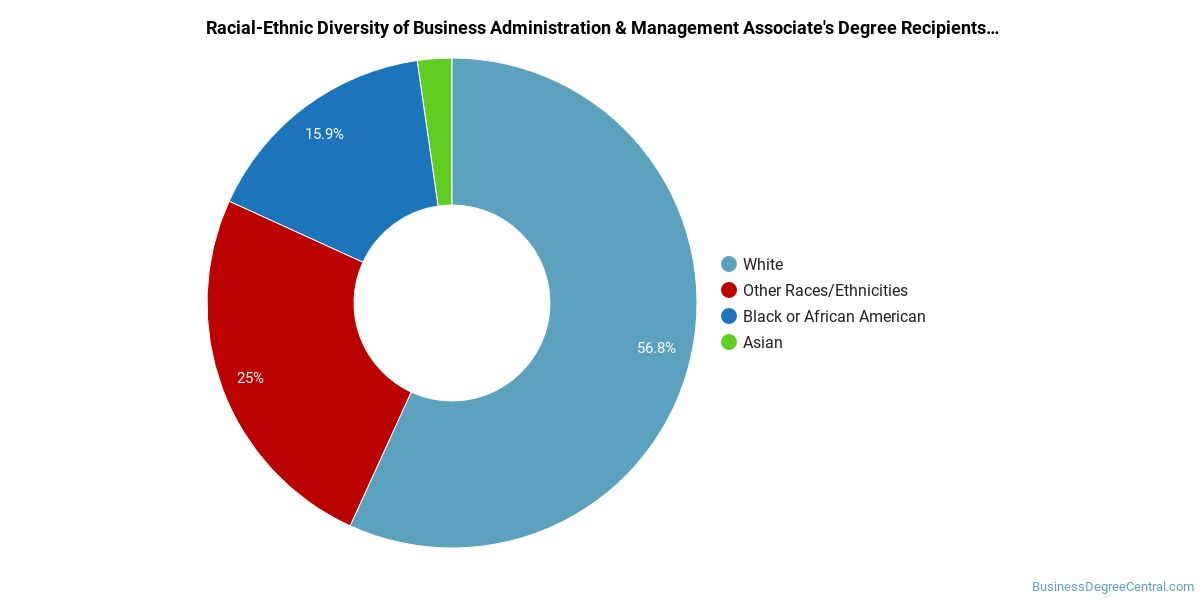
Minority students account for 36% of Business Administration & Management associate’s degree recipients at Sullivan University, below the national average of 51%.*
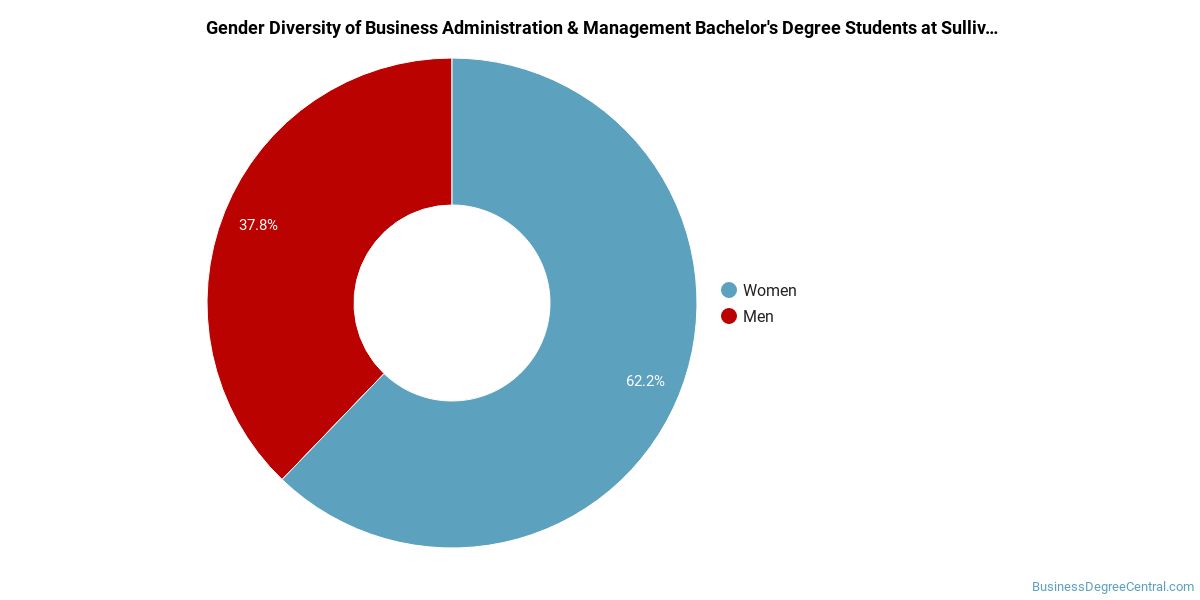
Business Administration & Management Bachelor’s Program at Sullivan University
Of the 33 bachelor’s business administration & management graduates at Sullivan University, 48% were women (16) and 52% were men (17).
The following table and chart show the race/ethnicity of Business Administration & Management bachelor’s degree recipients at Sullivan University.
| Race / Ethnicity | Number of Graduates |
|---|---|
| White | 24 |
| Hispanic / Latino | 1 |
| Black / African American | 4 |
| Two or More Races | 4 |
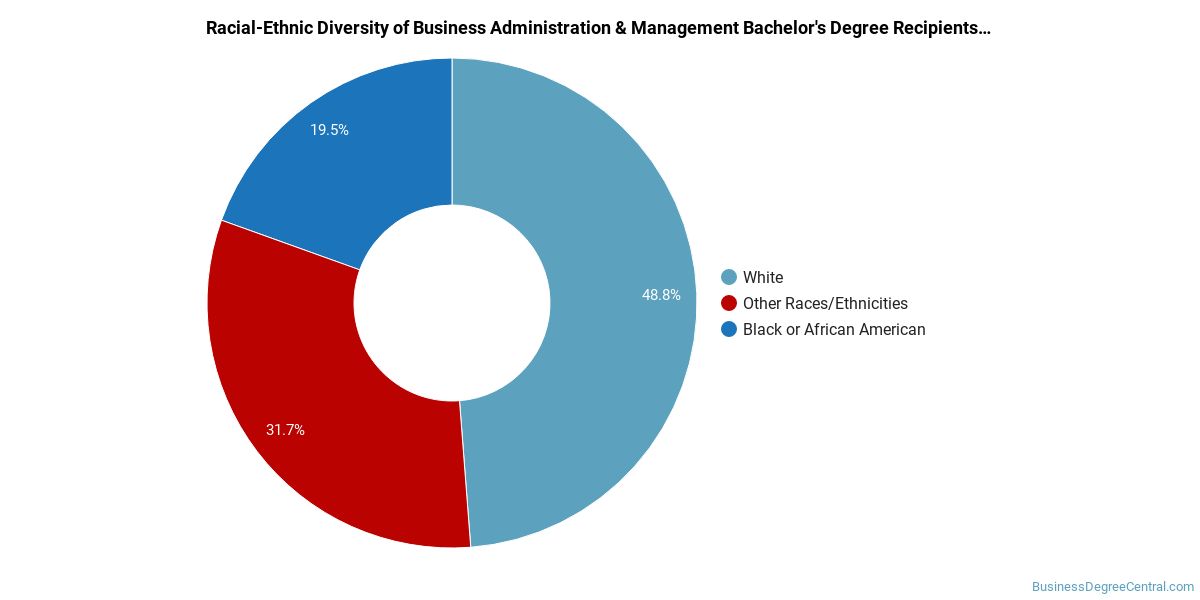
Racial-ethnic minorities make up 27% of Business Administration & Management bachelor’s degree recipients at Sullivan University, below the national average of 41%.*
Business Administration & Management Master’s Program at Sullivan University
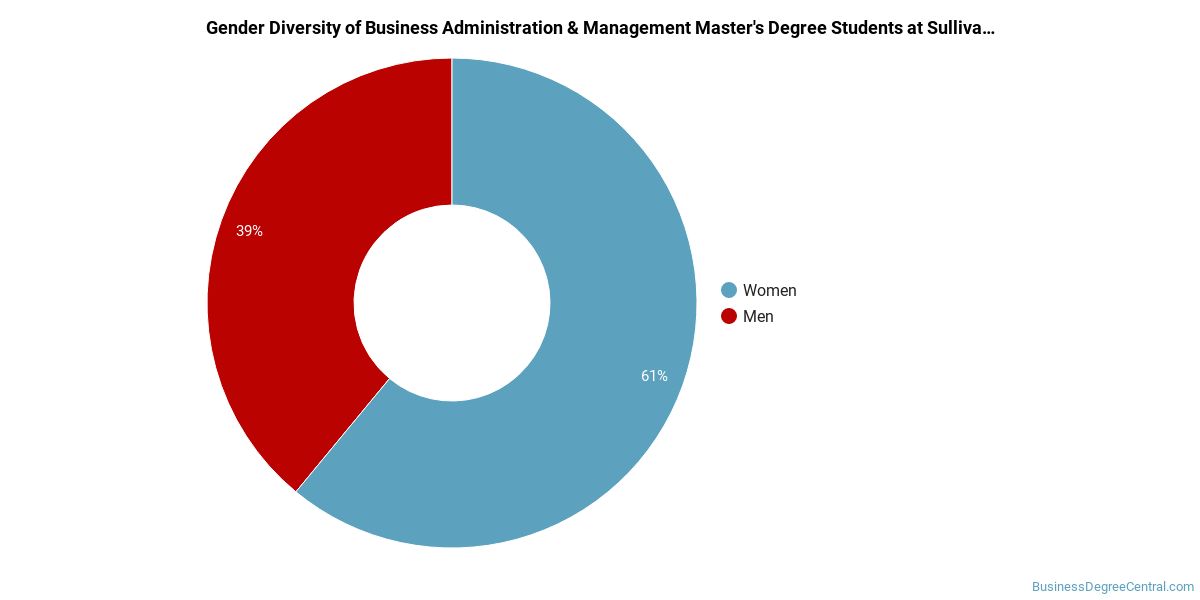
Among the 48 master’s business administration & management degrees awarded at Sullivan University, 60% were women (29) and 40% were men (19).
The following table and chart show the race/ethnicity of Business Administration & Management master’s degree recipients at Sullivan University.
| Race / Ethnicity | Number of Graduates |
|---|---|
| White | 18 |
| Hispanic / Latino | 1 |
| Black / African American | 11 |
| Native Hawaiian / Pacific Islander | 1 |
| Two or More Races | 1 |
| International (Nonresident) | 10 |
| Unknown | 6 |
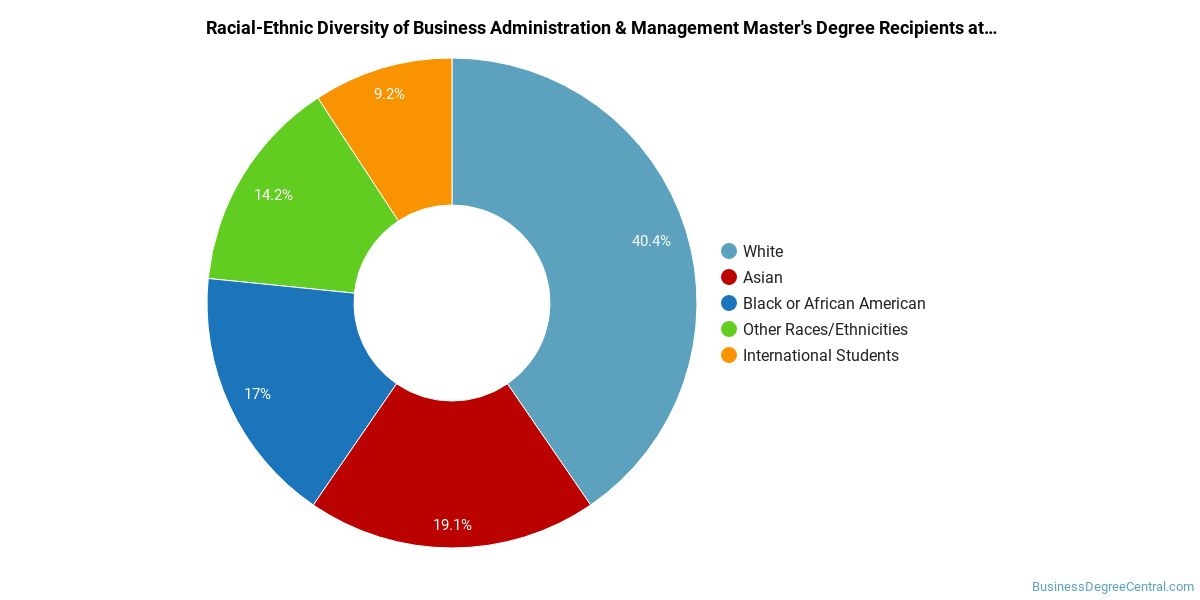
Racial-ethnic minorities make up 29% of Business Administration & Management master’s degree recipients at Sullivan University, below the national average of 36%.*
Business Administration & Management Doctoral Program at Sullivan University
Among the 4 doctoral business administration & management graduates at Sullivan University, 50% were women (2) and 50% were men (2).

The following table and chart show the race/ethnicity of Business Administration & Management doctoral degree recipients at Sullivan University.
| Race / Ethnicity | Number of Graduates |
|---|---|
| White | 2 |
| Asian | 1 |
| International (Nonresident) | 1 |

Racial-ethnic minorities make up 25% of Business Administration & Management doctoral degree recipients at Sullivan University, lower than the national average of 44%.*
*The racial-ethnic minorities figure is the total number of graduates minus White, international (nonresident), and unknown-race graduates.
More Specific Business Administration & Management Concentrations at Sullivan University
The Business Administration & Management program at Sullivan University breaks down into more specific concentrations:
| Concentration | Graduates |
|---|---|
| Business Administration & Management | 120 |
| Supply Chain Management | 2 |
| Organizational Leadership | 2 |
Best-Paid Careers for Business Administration & Management Graduates
Students who finish Business Administration & Management program at Sullivan University go on to a range of careers. The table below ranks the top-paying careers for Business Administration & Management majors, ordered by median annual salary:
| Occupation | Nationwide Median Wage |
|---|---|
| Loss Prevention Managers | $165,723 |
| Geothermal Production Managers | $160,381 |
| Administrative Services Managers | $158,084 |
| Facilities Managers | $157,669 |
| Biomass Power Plant Managers | $146,025 |
| Supply Chain Managers | $138,103 |
| Medical and Health Services Managers | $129,557 |
| Security Management Specialists | $128,654 |
| Industrial Production Managers | $126,666 |
| Wind Energy Operations Managers | $122,567 |
References
- IPEDS — Integrated Postsecondary Education Data System
- U.S. Department of Education — College Scorecard
- O*NET Online (Bureau of Labor Statistics)
- National Center for Education Statistics
More about our data sources and methodologies.
BusinessDegreeCentral.com provides higher-education, college and university, degree, program, career, salary, and other helpful information to students, faculty, institutions, and other internet audiences. Presented information and data are subject to change. Inclusion on this website does not imply or represent a direct relationship with the company, school, or brand. Information, though believed correct at time of publication, may not be correct, and no warranty is provided. Contact the schools to verify any information before relying on it. Financial aid may be available for those who qualify. The displayed options may include sponsored or recommended results, not necessarily based on your preferences.
© BusinessDegreeCentral.com – All Rights Reserved.