Business Administration & Management at Stevens Institute of Technology
What traits are you looking for in a school for Business Administration & Management, consider the program at Stevens Institute of Technology. We’ve gathered the following information to help you decide.
Stevens Institute of Technology is located in Hoboken, NJ.
In the most recent year for which we have data, 292 business administration & management degrees were awarded at Stevens Institute of Technology.
Featured schools near , edit
Online & Distance Learning at Stevens Institute of Technology
Online coursework is an option at Stevens Institute of Technology. Among 8,469 students, 1,159 (14%) were enrolled entirely in distance education and 2,669 (32%) took at least some classes online.
Business Administration & Management Rankings at Stevens Institute of Technology
Rankings can help you compare Stevens Institute of Technology’s Business Administration & Management program against peer institutions.
Bachelor’s-Level Rankings
| Ranking | Scope | Rank |
|---|---|---|
| Best Schools (Quality) | New Jersey | #6 of 48 |
| Best Schools (Quality) | Middle Atlantic (Region) | #41 of 326 |
| Best Value | New Jersey | #45 of 46 |
| Best Schools (Quality) | Nationwide | #180 of 2,012 |
| Best Value | Middle Atlantic (Region) | #312 of 319 |
| Best Value | Nationwide | #1959 of 1,983 |
Master’s-Level Rankings
| Ranking | Scope | Rank |
|---|---|---|
| Best Schools (Quality) | New Jersey | #6 of 48 |
| Best Schools (Quality) | Middle Atlantic (Region) | #41 of 326 |
| Best Value | New Jersey | #45 of 46 |
| Best Schools (Quality) | Nationwide | #180 of 2,012 |
| Best Value | Middle Atlantic (Region) | #312 of 319 |
| Best Value | Nationwide | #1959 of 1,983 |
Doctoral-Level Rankings
| Ranking | Scope | Rank |
|---|---|---|
| Best Schools (Quality) | New Jersey | #6 of 48 |
| Best Schools (Quality) | Middle Atlantic (Region) | #41 of 326 |
| Best Value | New Jersey | #45 of 46 |
| Best Schools (Quality) | Nationwide | #180 of 2,012 |
| Best Value | Middle Atlantic (Region) | #312 of 319 |
| Best Value | Nationwide | #1959 of 1,983 |
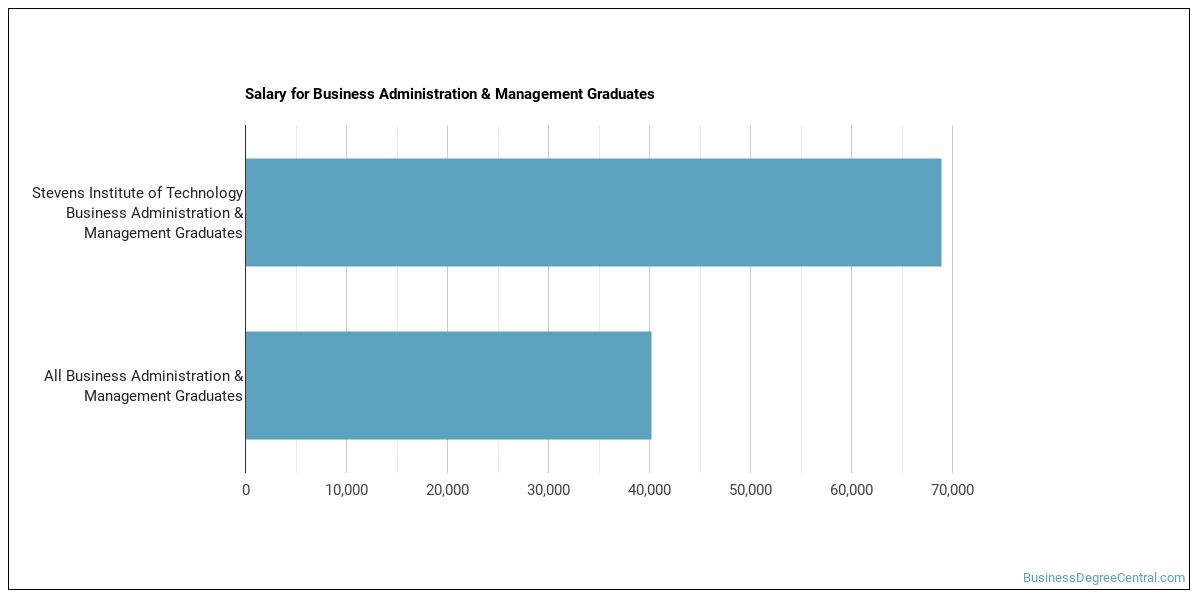
Earnings for Business Administration & Management Graduates from Stevens Institute of Technology
Students who complete Stevens Institute of Technology’s Business Administration & Management program report the following median earnings (per the U.S. Department of Education’s College Scorecard):
| Years After Graduation | Median Earnings |
|---|---|
| 1 year | $85,388 |
| 2 years | $106,932 |
| 3 years | $114,949 |
| 4 years | $122,300 |
| 5 years | $160,354 |
How do these earnings stack up against the rest of the school? Four years out, Business Administration & Management graduates from Stevens Institute of Technology report median earnings of $122,300, compared with $110,553 for all Stevens Institute of Technology graduates — about 11% higher than the school-wide median.

Median Debt at Graduation
Median student loan debt for Business Administration & Management graduates from Stevens Institute of Technology is $27,000.
Student Demographics & Diversity
Take a look at the diversity of Business Administration & Management graduates at Stevens Institute of Technology, by degree type.
Looking at the program as a whole, Business Administration & Management graduates at Stevens Institute of Technology are 42% women (123) and 58% men (169).
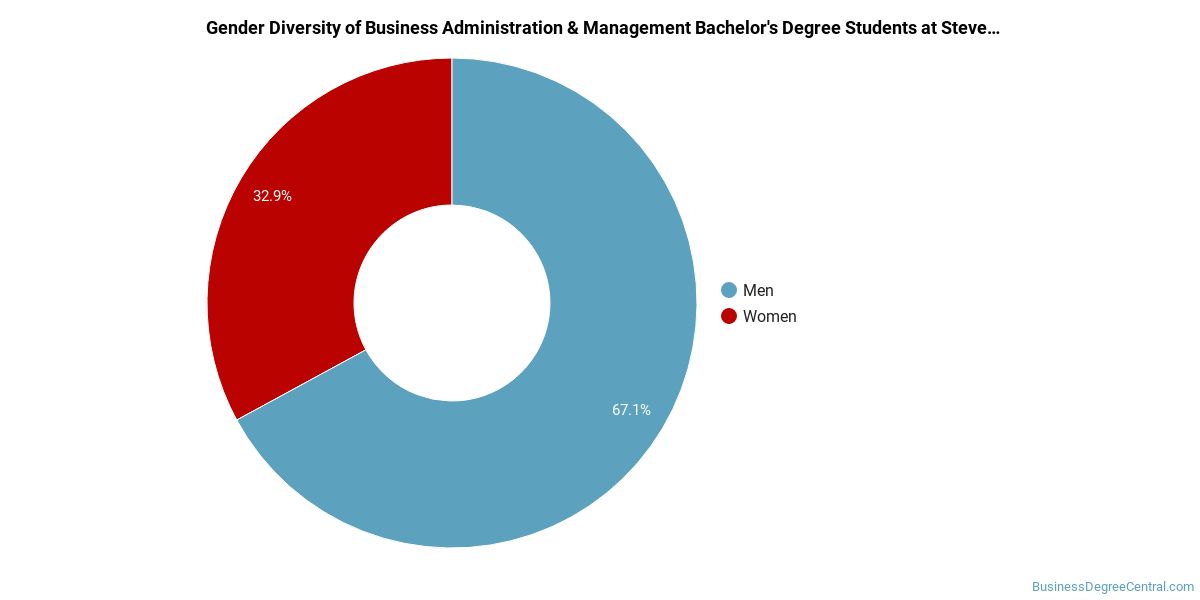
Business Administration & Management Bachelor’s Program at Stevens Institute of Technology
Among the 92 bachelor’s business administration & management degrees awarded at Stevens Institute of Technology, 35% were women (32) and 65% were men (60).
The following table and chart show the race/ethnicity of Business Administration & Management bachelor’s degree recipients at Stevens Institute of Technology.
| Race / Ethnicity | Number of Graduates |
|---|---|
| White | 43 |
| Hispanic / Latino | 17 |
| Black / African American | 3 |
| Asian | 19 |
| Two or More Races | 1 |
| International (Nonresident) | 5 |
| Unknown | 4 |
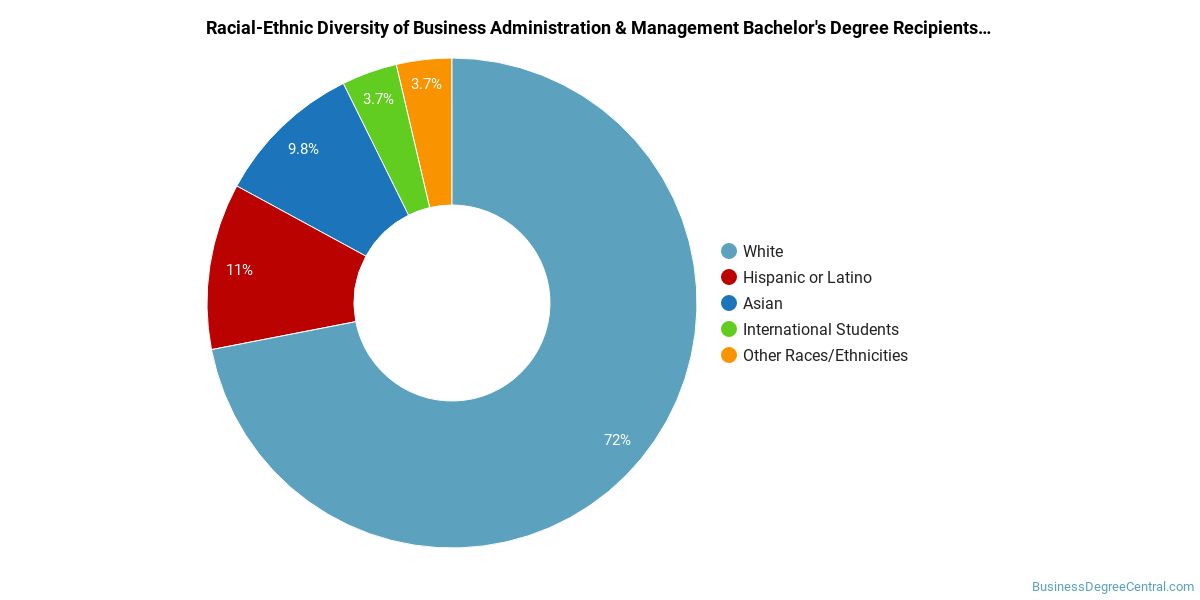
Minority students account for 43% of Business Administration & Management bachelor’s degree recipients at Stevens Institute of Technology, above the national average of 41%.*
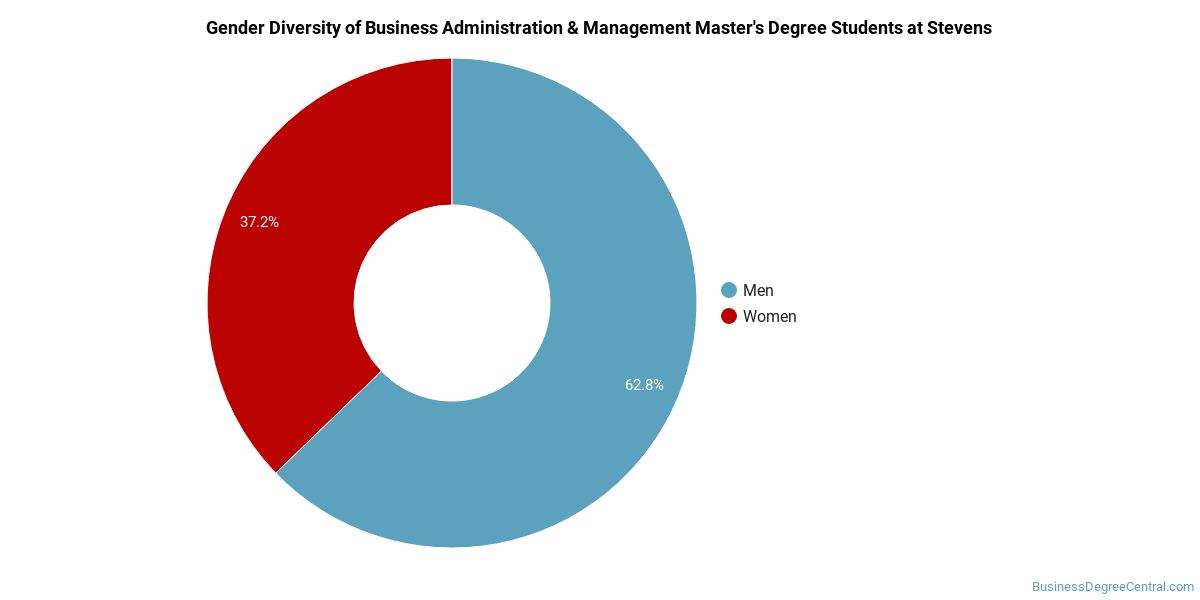
Business Administration & Management Master’s Program at Stevens Institute of Technology
Of the 164 master’s business administration & management graduates at Stevens Institute of Technology, 48% were women (78) and 52% were men (86).
The following table and chart show the race/ethnicity of Business Administration & Management master’s degree recipients at Stevens Institute of Technology.
| Race / Ethnicity | Number of Graduates |
|---|---|
| White | 35 |
| Hispanic / Latino | 3 |
| Black / African American | 4 |
| Asian | 16 |
| Two or More Races | 1 |
| International (Nonresident) | 77 |
| Unknown | 28 |
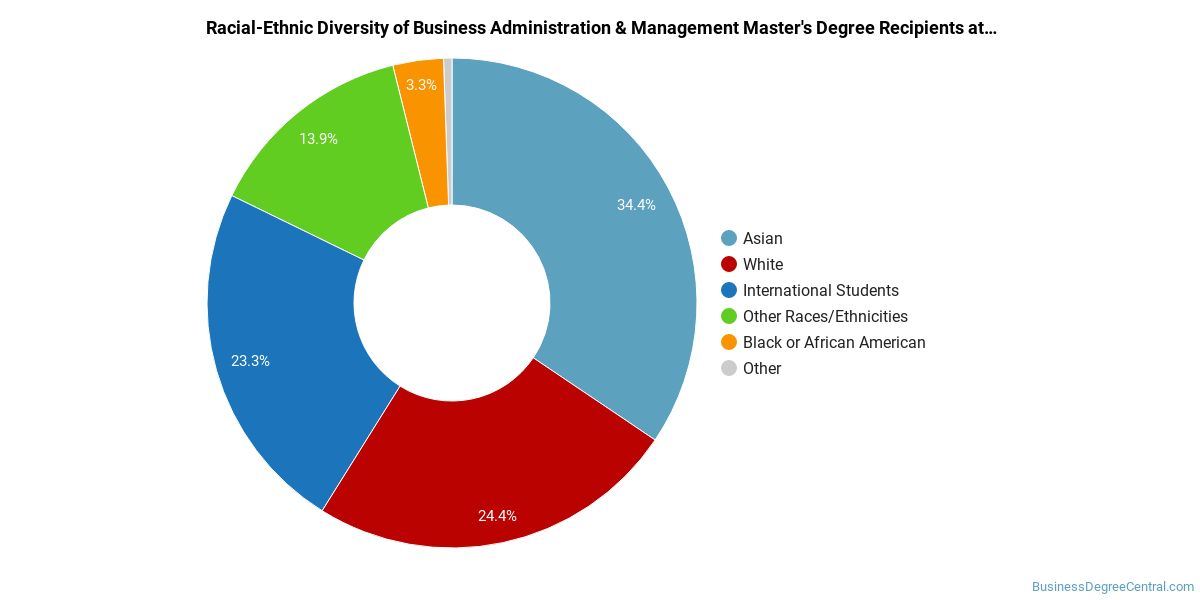
Racial-ethnic minorities make up 15% of Business Administration & Management master’s degree recipients at Stevens Institute of Technology, lower than the national average of 36%.*
Business Administration & Management Doctoral Program at Stevens Institute of Technology
Of the 4 doctoral business administration & management graduates at Stevens Institute of Technology, 25% were women (1) and 75% were men (3).

The following table and chart show the race/ethnicity of Business Administration & Management doctoral degree recipients at Stevens Institute of Technology.
| Race / Ethnicity | Number of Graduates |
|---|---|
| International (Nonresident) | 3 |
| Unknown | 1 |

*The racial-ethnic minorities figure is the total number of graduates minus White, international (nonresident), and unknown-race graduates.
More Specific Business Administration & Management Concentrations at Stevens Institute of Technology
The Business Administration & Management program at Stevens Institute of Technology breaks down into more specific concentrations:
| Concentration | Graduates |
|---|---|
| Business Administration & Management | 117 |
| Project Management | 1 |
| Interior Design Management | 174 |
Best-Paid Careers for Business Administration & Management Graduates
Students who finish Business Administration & Management program at Stevens Institute of Technology work across a variety of fields. Here are the top-paying careers for Business Administration & Management majors, ordered by median annual salary:
| Occupation | Nationwide Median Wage |
|---|---|
| Loss Prevention Managers | $165,723 |
| Geothermal Production Managers | $160,381 |
| Administrative Services Managers | $158,084 |
| Facilities Managers | $157,669 |
| Biomass Power Plant Managers | $146,025 |
| Supply Chain Managers | $138,103 |
| Medical and Health Services Managers | $129,557 |
| Security Management Specialists | $128,654 |
| Industrial Production Managers | $126,666 |
| Wind Energy Operations Managers | $122,567 |
References
- IPEDS — Integrated Postsecondary Education Data System
- U.S. Department of Education — College Scorecard
- O*NET Online (Bureau of Labor Statistics)
- National Center for Education Statistics
More about our data sources and methodologies.
BusinessDegreeCentral.com provides higher-education, college and university, degree, program, career, salary, and other helpful information to students, faculty, institutions, and other internet audiences. Presented information and data are subject to change. Inclusion on this website does not imply or represent a direct relationship with the company, school, or brand. Information, though believed correct at time of publication, may not be correct, and no warranty is provided. Contact the schools to verify any information before relying on it. Financial aid may be available for those who qualify. The displayed options may include sponsored or recommended results, not necessarily based on your preferences.
© BusinessDegreeCentral.com – All Rights Reserved.