Management Science at Seattle University
What traits are you looking for in a school for Management Science, take a look at what Seattle University. We’ve gathered the following information to help you decide.
Seattle University is in Seattle, WA.
During the most recent reporting year, 106 management science degrees were granted at Seattle University.
Featured schools near , edit
Online & Distance Learning at Seattle University
Many students take online classes at Seattle University. Among 7,189 students, 564 (8%) were enrolled entirely in distance education and 915 (13%) took at least some classes online.
Management Science Rankings at Seattle University
Use these rankings to compare Seattle University’s Management Science program to other colleges that offer this major.
Bachelor’s-Level Rankings
| Ranking | Scope | Rank |
|---|---|---|
| Best Schools (Quality) | Washington | #2 of 4 |
| Best Value | Washington | #6 of 6 |
| Best Schools (Quality) | Far Western (Region) | #16 of 27 |
| Best Value | Far Western (Region) | #24 of 31 |
| Best Schools (Quality) | Nationwide | #64 of 225 |
| Best Value | Nationwide | #219 of 249 |
Master’s-Level Rankings
| Ranking | Scope | Rank |
|---|---|---|
| Best Schools (Quality) | Washington | #2 of 4 |
| Best Value | Washington | #6 of 6 |
| Best Schools (Quality) | Far Western (Region) | #16 of 27 |
| Best Value | Far Western (Region) | #24 of 31 |
| Best Schools (Quality) | Nationwide | #64 of 225 |
| Best Value | Nationwide | #219 of 249 |
Student Demographics & Diversity
Take a look at the student demographics for Management Science graduates at Seattle University, broken down by degree level.
Looking at the program as a whole, Management Science graduates at Seattle University are 61% women (65) and 39% men (41).
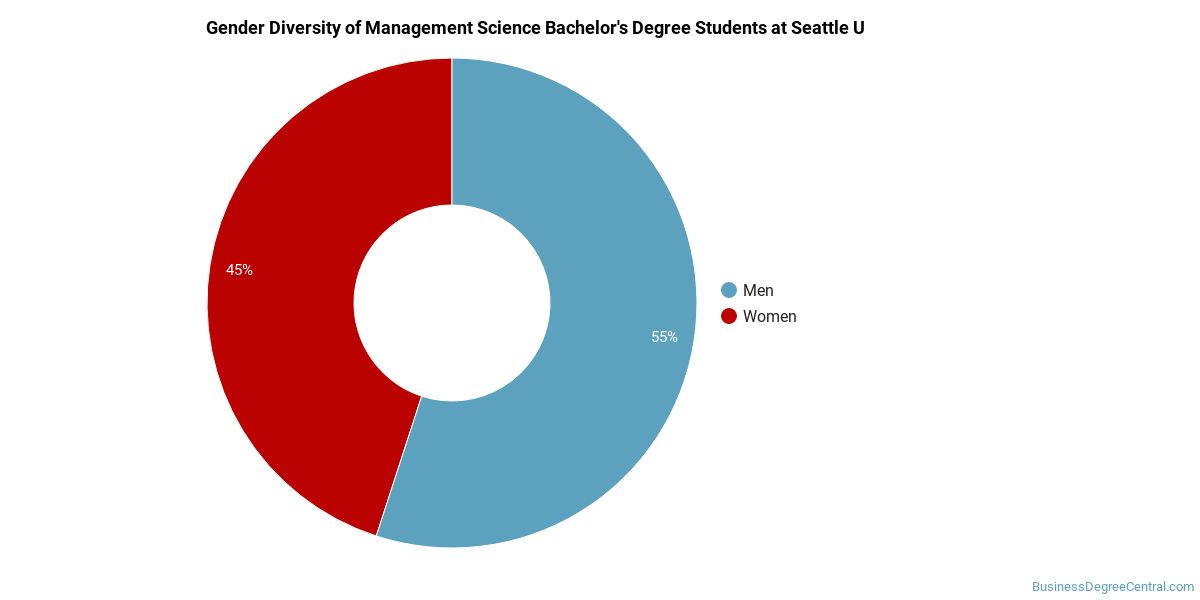
Management Science Bachelor’s Program at Seattle University
Among the 36 bachelor’s management science graduates at Seattle University, 56% were women (20) and 44% were men (16).
The following table and chart show the race/ethnicity of Management Science bachelor’s degree recipients at Seattle University.
| Race / Ethnicity | Number of Graduates |
|---|---|
| White | 6 |
| Hispanic / Latino | 2 |
| Asian | 11 |
| Native Hawaiian / Pacific Islander | 1 |
| Two or More Races | 3 |
| International (Nonresident) | 13 |
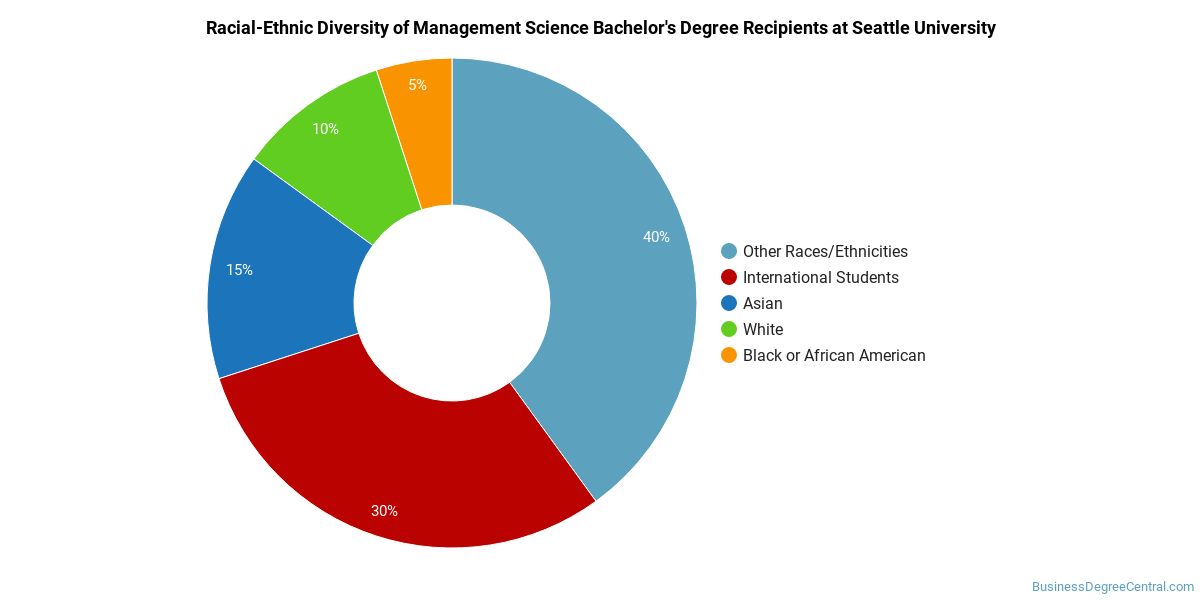
Minority students account for 47% of Management Science bachelor’s degree recipients at Seattle University, above the national average of 41%.*
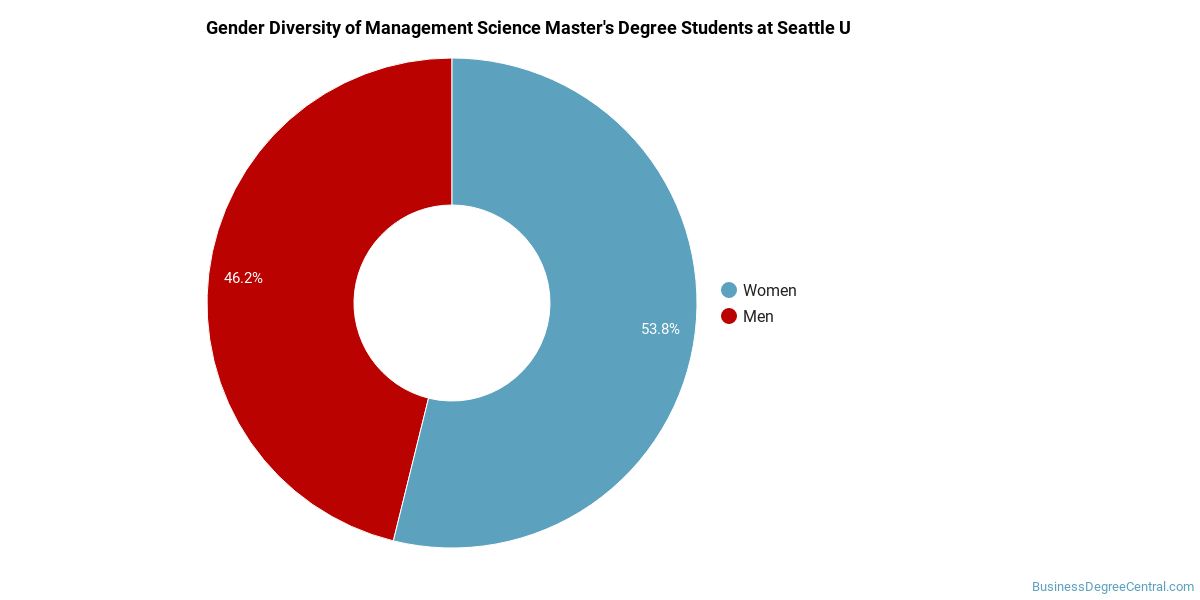
Management Science Master’s Program at Seattle University
Among the 59 master’s management science graduates at Seattle University, 69% were women (41) and 31% were men (18).
The following table and chart show the race/ethnicity of Management Science master’s degree recipients at Seattle University.
| Race / Ethnicity | Number of Graduates |
|---|---|
| White | 18 |
| Hispanic / Latino | 1 |
| Black / African American | 2 |
| Asian | 8 |
| International (Nonresident) | 28 |
| Unknown | 2 |
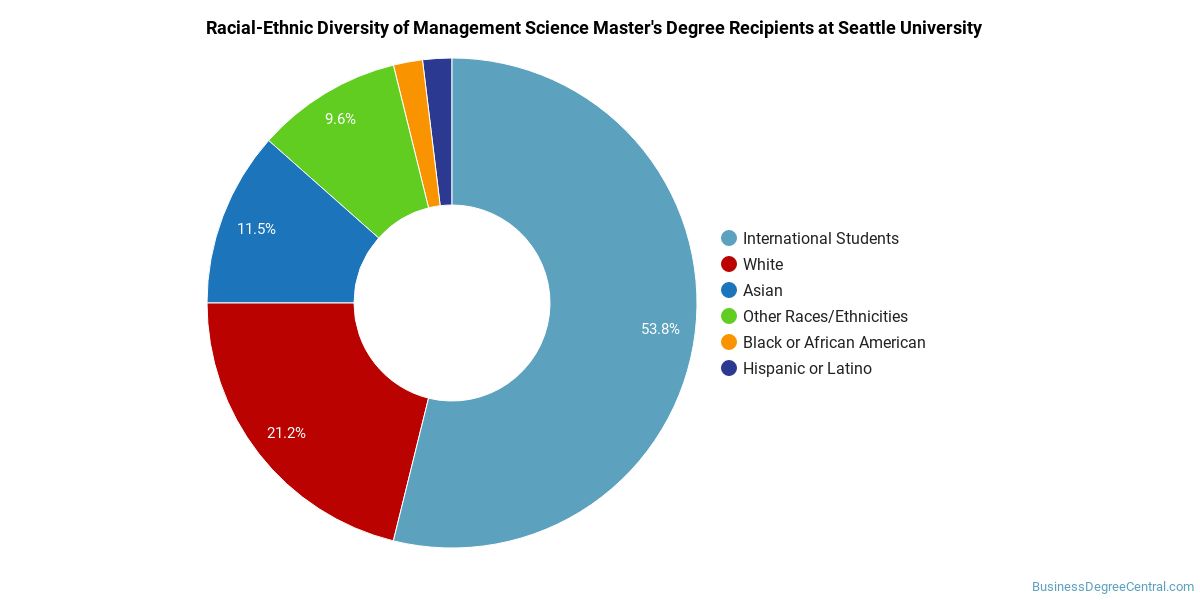
Racial-ethnic minorities make up 19% of Management Science master’s degree recipients at Seattle University, below the national average of 25%.*
*The racial-ethnic minorities figure is the total number of graduates minus White, international (nonresident), and unknown-race graduates.
Best-Paid Careers for Management Science Graduates
Graduates of the Management Science program at Seattle University pursue many career paths. Here are the top-paying careers for Management Science graduates, ordered by median annual salary:
| Occupation | Nationwide Median Wage |
|---|---|
| General and Operations Managers | $149,694 |
| Chief Executives | $138,534 |
| Chief Sustainability Officers | $96,628 |
| Management Analysts | $51,034 |
References
- IPEDS — Integrated Postsecondary Education Data System
- U.S. Department of Education — College Scorecard
- O*NET Online (Bureau of Labor Statistics)
- National Center for Education Statistics
More about our data sources and methodologies.
BusinessDegreeCentral.com provides higher-education, college and university, degree, program, career, salary, and other helpful information to students, faculty, institutions, and other internet audiences. Presented information and data are subject to change. Inclusion on this website does not imply or represent a direct relationship with the company, school, or brand. Information, though believed correct at time of publication, may not be correct, and no warranty is provided. Contact the schools to verify any information before relying on it. Financial aid may be available for those who qualify. The displayed options may include sponsored or recommended results, not necessarily based on your preferences.
© BusinessDegreeCentral.com – All Rights Reserved.