Business Administration & Management at Saint Peter’s University
If you plan to study Business Administration & Management, take a look at what Saint Peter’s University. Get started with the following essential facts.
Saint Peter’s University is in Jersey City, NJ.
In the most recent year for which we have data, 88 business administration & management graduations were recorded at Saint Peter’s University.
Featured schools near , edit
Studying Online at Saint Peter’s University
Distance learning is available at Saint Peter’s University. Of 3,572 students, 742 (21%) studied exclusively online and 1,642 (46%) took at least some classes online.
Business Administration & Management Rankings at Saint Peter’s University
These rankings give you a sense of how Saint Peter’s University’s Business Administration & Management program against peer institutions.
Bachelor’s-Level Rankings
| Ranking | Scope | Rank |
|---|---|---|
| Best Value | New Jersey | #22 of 46 |
| Best Schools (Quality) | New Jersey | #32 of 48 |
| Best Value | Middle Atlantic (Region) | #90 of 319 |
| Best Schools (Quality) | Middle Atlantic (Region) | #188 of 326 |
| Best Value | Nationwide | #816 of 1,983 |
| Best Schools (Quality) | Nationwide | #942 of 2,012 |
Master’s-Level Rankings
| Ranking | Scope | Rank |
|---|---|---|
| Best Value | New Jersey | #22 of 46 |
| Best Schools (Quality) | New Jersey | #32 of 48 |
| Best Value | Middle Atlantic (Region) | #90 of 319 |
| Best Schools (Quality) | Middle Atlantic (Region) | #188 of 326 |
| Best Value | Nationwide | #816 of 1,983 |
| Best Schools (Quality) | Nationwide | #942 of 2,012 |
Associate-Level Rankings
| Ranking | Scope | Rank |
|---|---|---|
| Best Value | New Jersey | #22 of 46 |
| Best Schools (Quality) | New Jersey | #32 of 48 |
| Best Value | Middle Atlantic (Region) | #90 of 319 |
| Best Schools (Quality) | Middle Atlantic (Region) | #188 of 326 |
| Best Value | Nationwide | #816 of 1,983 |
| Best Schools (Quality) | Nationwide | #942 of 2,012 |
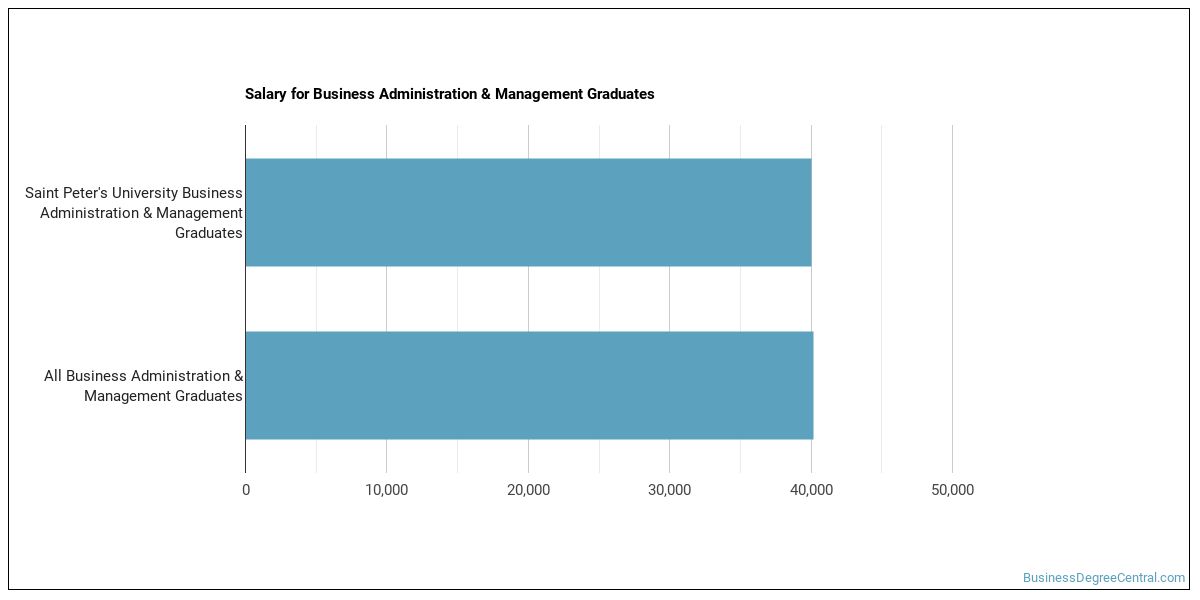
Earnings for Business Administration & Management Graduates from Saint Peter’s University
Graduates of Saint Peter’s University’s Business Administration & Management program earn the following amounts (per the U.S. Department of Education’s College Scorecard):
| Years After Graduation | Median Earnings |
|---|---|
| 1 year | $43,793 |
| 2 years | $42,682 |
| 3 years | $39,317 |
| 4 years | $51,375 |
| 5 years | $61,790 |
How does this compare to the school overall? At the four-year mark, Business Administration & Management graduates from Saint Peter’s University report median earnings of $51,375, compared with $61,544 for all Saint Peter’s University graduates — about 17% lower than the school-wide median.

Median Debt at Graduation
The median debt for Business Administration & Management graduates from Saint Peter’s University stands at $19,000.
Student Demographics & Diversity
Take a look at the composition of Business Administration & Management graduates at Saint Peter’s University, by degree type.
Looking at the program as a whole, Business Administration & Management graduates at Saint Peter’s University are 65% women (57) and 35% men (31).
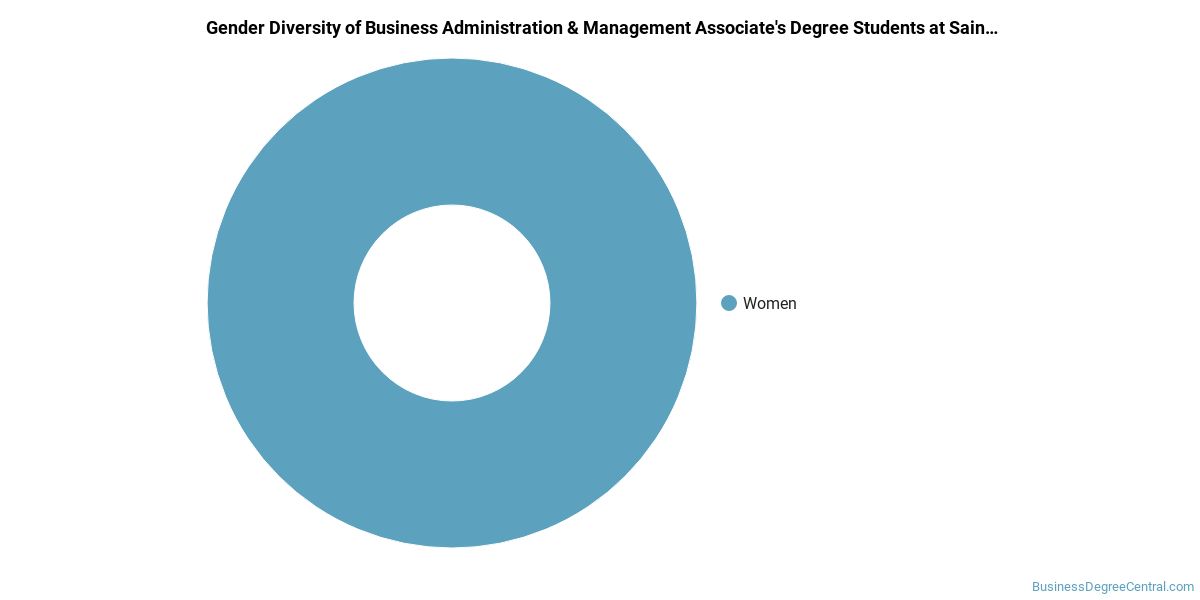
Business Administration & Management Associate’s Program at Saint Peter’s University
Among the 1 associate’s business administration & management graduates at Saint Peter’s University, 100% were women (1) and 0% were men (0).
The following table and chart show the race/ethnicity of Business Administration & Management associate’s degree recipients at Saint Peter’s University.
| Race / Ethnicity | Number of Graduates |
|---|---|
| Black / African American | 1 |
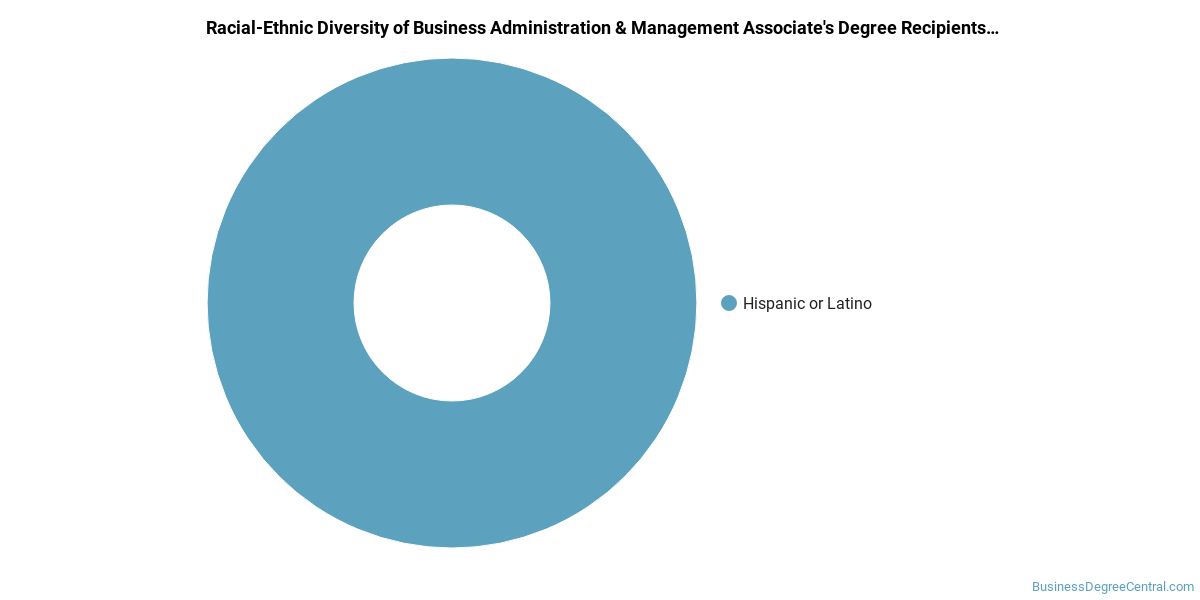
Racial-ethnic minorities make up 100% of Business Administration & Management associate’s degree recipients at Saint Peter’s University, higher than the national average of 51%.*
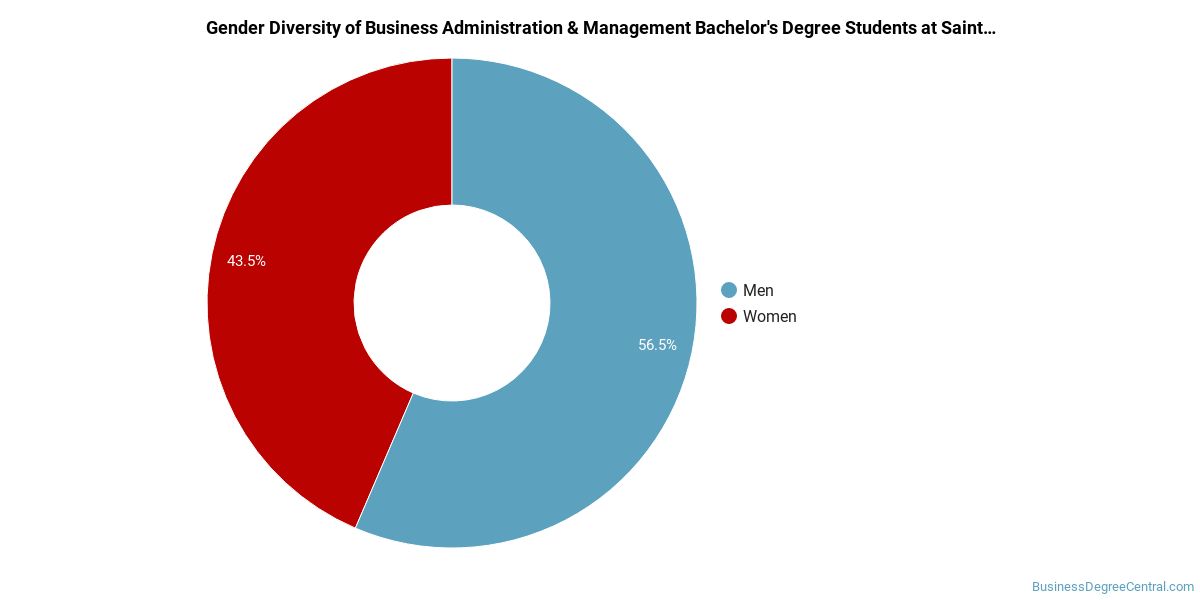
Business Administration & Management Bachelor’s Program at Saint Peter’s University
Of the 81 bachelor’s business administration & management degrees awarded at Saint Peter’s University, 63% were women (51) and 37% were men (30).
The following table and chart show the race/ethnicity of Business Administration & Management bachelor’s degree recipients at Saint Peter’s University.
| Race / Ethnicity | Number of Graduates |
|---|---|
| White | 57 |
| Hispanic / Latino | 16 |
| Black / African American | 4 |
| Asian | 3 |
| International (Nonresident) | 1 |
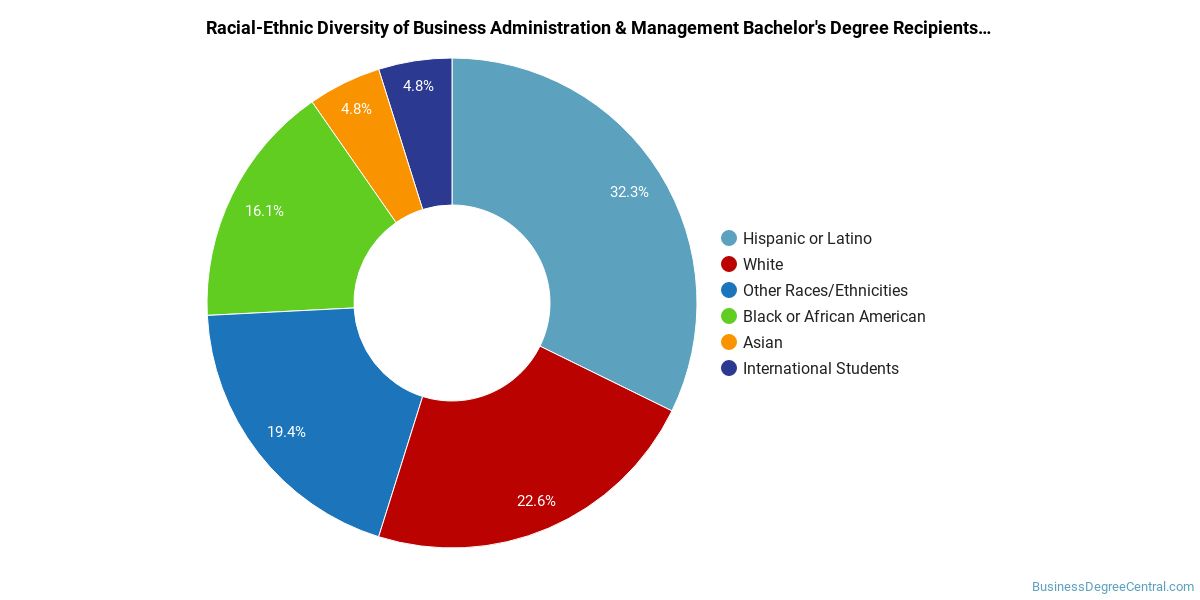
Racial-ethnic minorities make up 28% of Business Administration & Management bachelor’s degree recipients at Saint Peter’s University, below the national average of 41%.*
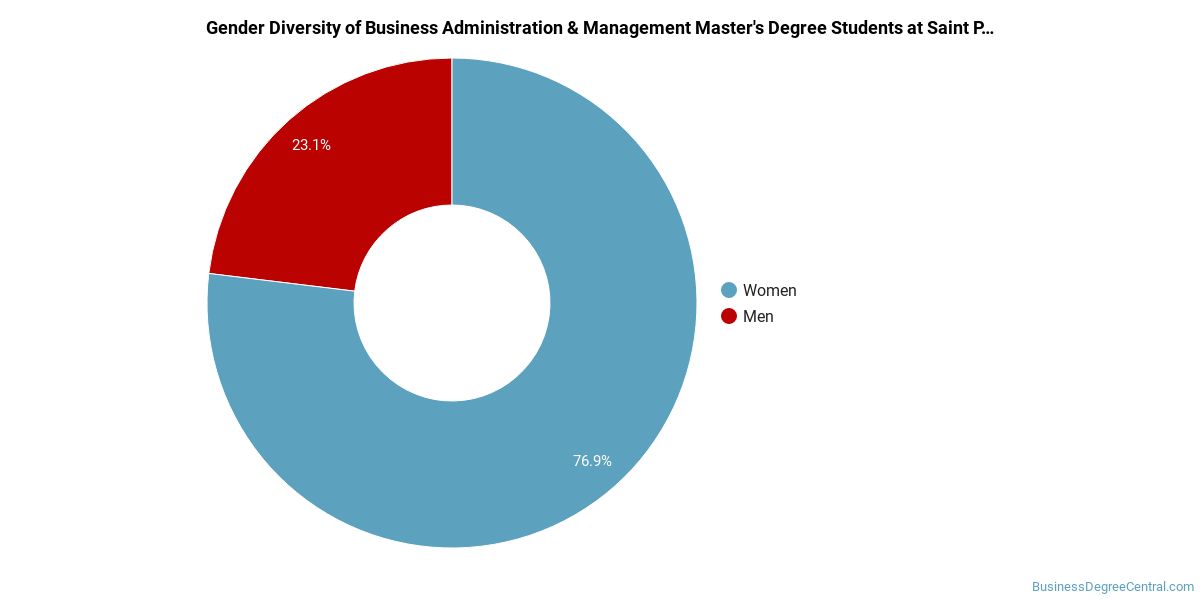
Business Administration & Management Master’s Program at Saint Peter’s University
Among the 6 master’s business administration & management degrees awarded at Saint Peter’s University, 83% were women (5) and 17% were men (1).
The following table and chart show the race/ethnicity of Business Administration & Management master’s degree recipients at Saint Peter’s University.
| Race / Ethnicity | Number of Graduates |
|---|---|
| Hispanic / Latino | 3 |
| Black / African American | 1 |
| International (Nonresident) | 1 |
| Unknown | 1 |
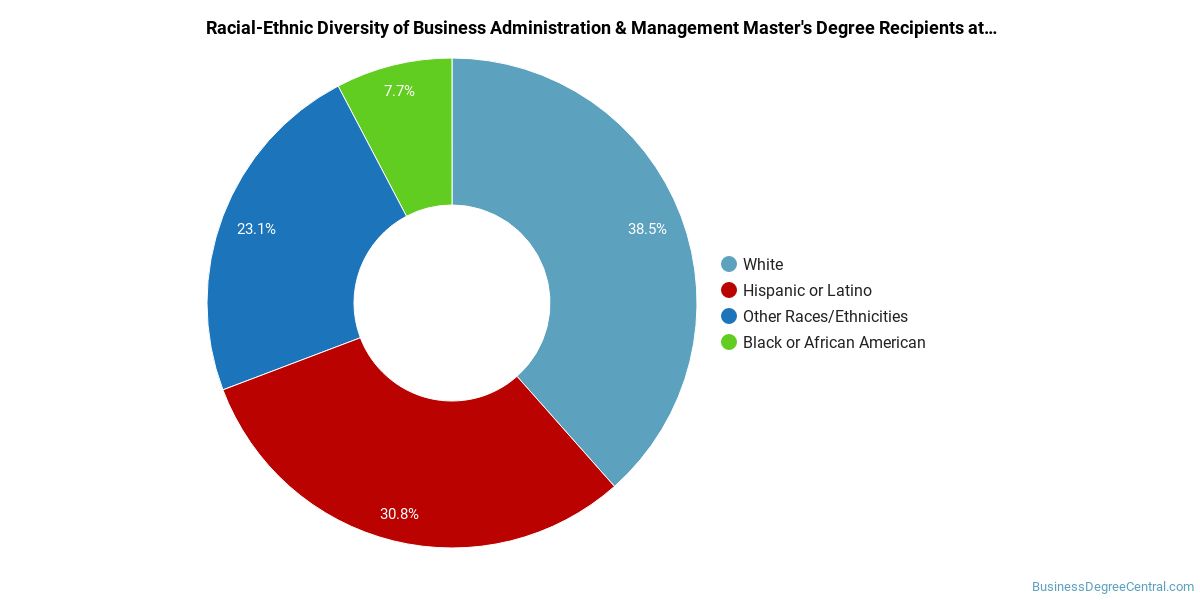
Minority students account for 67% of Business Administration & Management master’s degree recipients at Saint Peter’s University, above the national average of 36%.*
*The racial-ethnic minorities figure is the total number of graduates minus White, international (nonresident), and unknown-race graduates.
More Specific Business Administration & Management Concentrations at Saint Peter’s University
The Business Administration & Management program at Saint Peter’s University offers more specialized concentrations:
| Concentration | Graduates |
|---|---|
| Business Administration & Management | 87 |
| Organizational Leadership | 1 |
Top-Paying Careers for Business Administration & Management Graduates
Students who finish Business Administration & Management program at Saint Peter’s University work across a variety of fields. The table below ranks the top-paying careers for Business Administration & Management majors, ordered by median annual salary:
| Occupation | Nationwide Median Wage |
|---|---|
| Loss Prevention Managers | $165,723 |
| Geothermal Production Managers | $160,381 |
| Administrative Services Managers | $158,084 |
| Facilities Managers | $157,669 |
| Biomass Power Plant Managers | $146,025 |
| Supply Chain Managers | $138,103 |
| Medical and Health Services Managers | $129,557 |
| Security Management Specialists | $128,654 |
| Industrial Production Managers | $126,666 |
| Wind Energy Operations Managers | $122,567 |
References
- IPEDS — Integrated Postsecondary Education Data System
- U.S. Department of Education — College Scorecard
- O*NET Online (Bureau of Labor Statistics)
- National Center for Education Statistics
More about our data sources and methodologies.
BusinessDegreeCentral.com provides higher-education, college and university, degree, program, career, salary, and other helpful information to students, faculty, institutions, and other internet audiences. Presented information and data are subject to change. Inclusion on this website does not imply or represent a direct relationship with the company, school, or brand. Information, though believed correct at time of publication, may not be correct, and no warranty is provided. Contact the schools to verify any information before relying on it. Financial aid may be available for those who qualify. The displayed options may include sponsored or recommended results, not necessarily based on your preferences.
© BusinessDegreeCentral.com – All Rights Reserved.