Business Administration & Management at St. John Fisher University
If you plan to study Business Administration & Management, take a look at what St. John Fisher University. We’ve gathered the following information to help you decide.
St. John Fisher University is in Rochester, NY.
During the most recent reporting year, 123 business administration & management degrees were awarded at St. John Fisher University.
Featured schools near , edit
Studying Online at St. John Fisher University
Many students take online classes at St. John Fisher University. Of 3,693 students, 729 (20%) were enrolled entirely in distance education and 1,083 (29%) took at least some classes online.
Business Administration & Management Rankings at St. John Fisher University
Rankings can help you compare St. John Fisher University’s Business Administration & Management program to other colleges that offer this major.
Bachelor’s-Level Rankings
| Ranking | Scope | Rank |
|---|---|---|
| Best Schools (Quality) | New York | #30 of 130 |
| Best Schools (Quality) | Middle Atlantic (Region) | #94 of 326 |
| Best Value | New York | #105 of 128 |
| Best Value | Middle Atlantic (Region) | #254 of 319 |
| Best Schools (Quality) | Nationwide | #463 of 2,012 |
| Best Value | Nationwide | #1760 of 1,983 |
Master’s-Level Rankings
| Ranking | Scope | Rank |
|---|---|---|
| Best Schools (Quality) | New York | #30 of 130 |
| Best Schools (Quality) | Middle Atlantic (Region) | #94 of 326 |
| Best Value | New York | #105 of 128 |
| Best Value | Middle Atlantic (Region) | #254 of 319 |
| Best Schools (Quality) | Nationwide | #463 of 2,012 |
| Best Value | Nationwide | #1760 of 1,983 |
Doctoral-Level Rankings
| Ranking | Scope | Rank |
|---|---|---|
| Best Schools (Quality) | New York | #30 of 130 |
| Best Schools (Quality) | Middle Atlantic (Region) | #94 of 326 |
| Best Value | New York | #105 of 128 |
| Best Value | Middle Atlantic (Region) | #254 of 319 |
| Best Schools (Quality) | Nationwide | #463 of 2,012 |
| Best Value | Nationwide | #1760 of 1,983 |
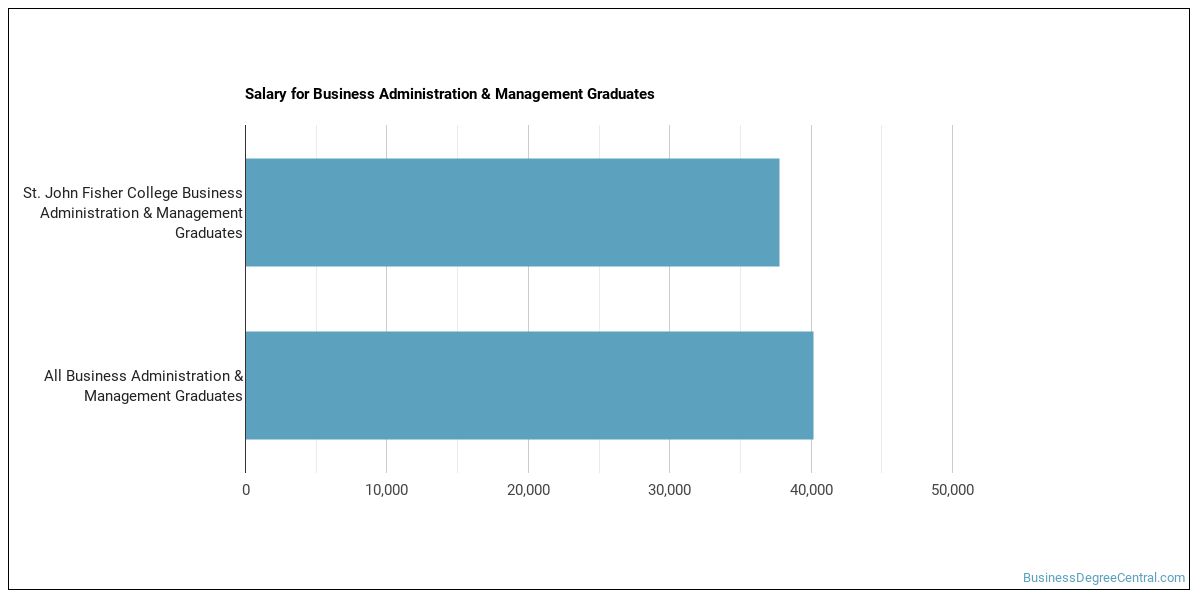
Earnings for Business Administration & Management Graduates from St. John Fisher University
Graduates of St. John Fisher University’s Business Administration & Management program report the following median earnings (per the U.S. Department of Education’s College Scorecard):
| Years After Graduation | Median Earnings |
|---|---|
| 1 year | $65,148 |
| 2 years | $59,042 |
| 3 years | $65,212 |
| 4 years | $71,488 |
| 5 years | $79,124 |
Is this above or below average for the school? Four years after graduating, Business Administration & Management graduates from St. John Fisher University earn a median of $71,488, compared with $75,469 for all St. John Fisher University graduates — about 5% lower than the school-wide median.

Median Debt at Graduation
Median student loan debt for Business Administration & Management graduates from St. John Fisher University is $24,845.
Student Demographics & Diversity
The following sections describe the composition of Business Administration & Management graduates at St. John Fisher University, by degree type.
Program-wide, Business Administration & Management graduates at St. John Fisher University are 50% women (62) and 50% men (61).
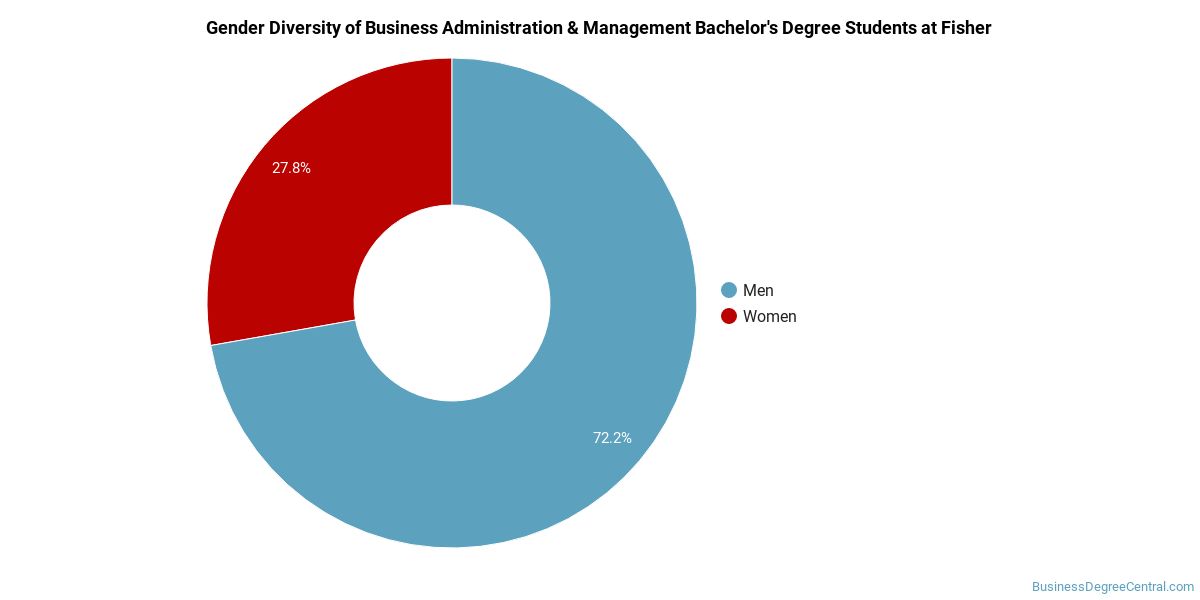
Business Administration & Management Bachelor’s Program at St. John Fisher University
Of the 31 bachelor’s business administration & management graduates at St. John Fisher University, 35% were women (11) and 65% were men (20).
The following table and chart show the race/ethnicity of Business Administration & Management bachelor’s degree recipients at St. John Fisher University.
| Race / Ethnicity | Number of Graduates |
|---|---|
| White | 26 |
| Asian | 3 |
| International (Nonresident) | 1 |
| Unknown | 1 |
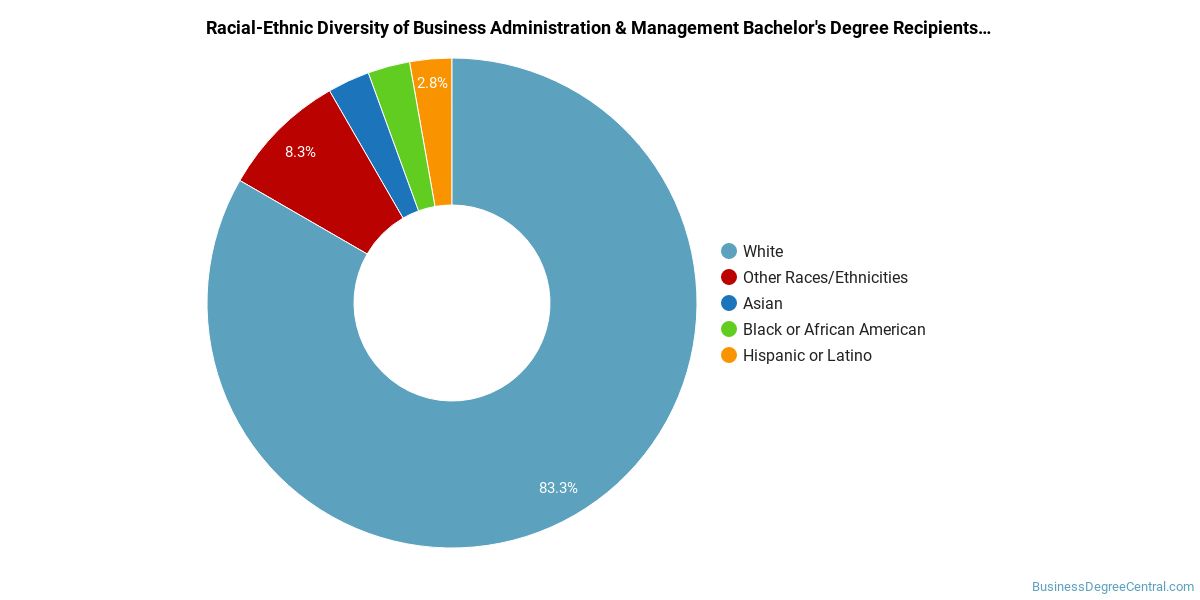
Minority students account for 10% of Business Administration & Management bachelor’s degree recipients at St. John Fisher University, lower than the national average of 41%.*
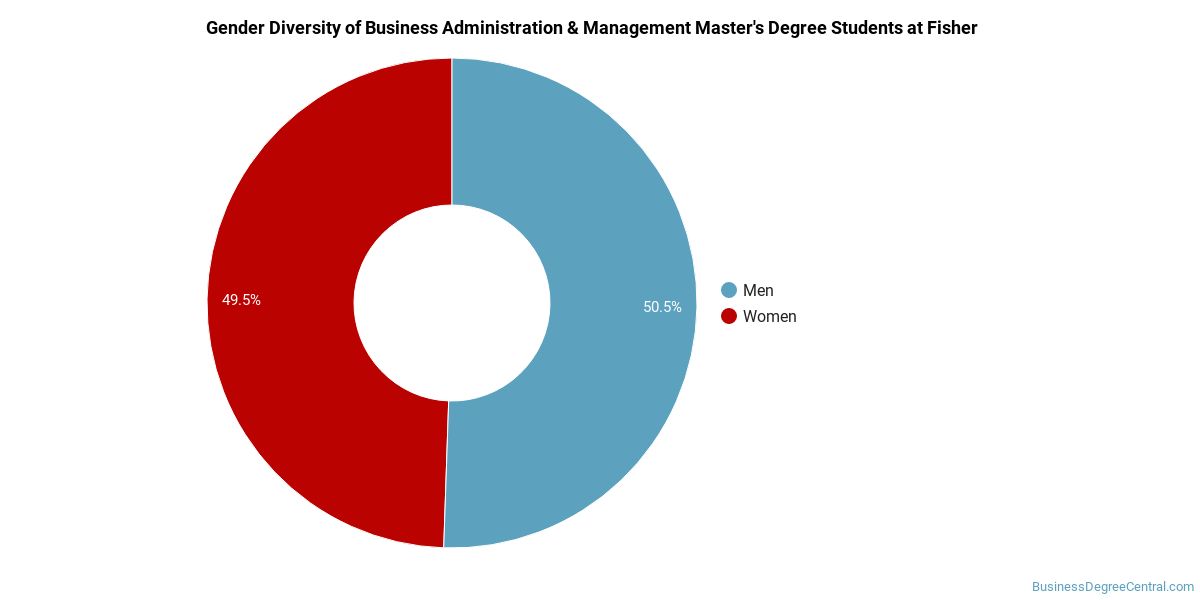
Business Administration & Management Master’s Program at St. John Fisher University
Among the 52 master’s business administration & management degrees awarded at St. John Fisher University, 37% were women (19) and 63% were men (33).
The following table and chart show the race/ethnicity of Business Administration & Management master’s degree recipients at St. John Fisher University.
| Race / Ethnicity | Number of Graduates |
|---|---|
| White | 45 |
| Hispanic / Latino | 1 |
| Black / African American | 1 |
| Asian | 3 |
| Native Hawaiian / Pacific Islander | 1 |
| International (Nonresident) | 1 |
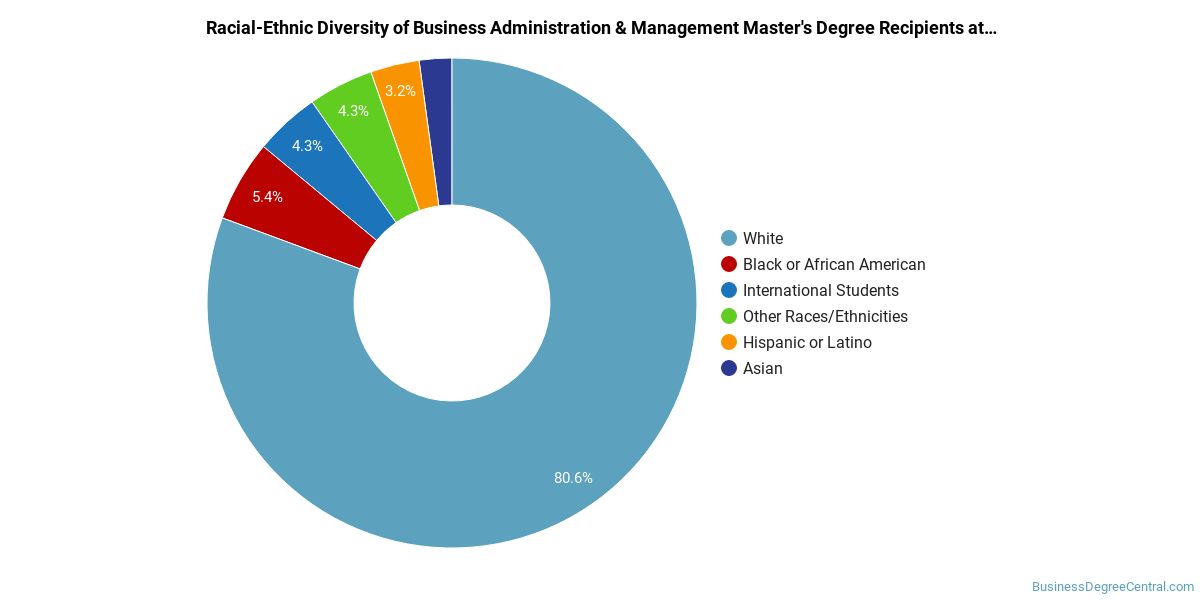
Racial-ethnic minorities make up 12% of Business Administration & Management master’s degree recipients at St. John Fisher University, lower than the national average of 36%.*
Business Administration & Management Doctoral Program at St. John Fisher University
Among the 40 doctoral business administration & management graduates at St. John Fisher University, 80% were women (32) and 20% were men (8).

The following table and chart show the race/ethnicity of Business Administration & Management doctoral degree recipients at St. John Fisher University.
| Race / Ethnicity | Number of Graduates |
|---|---|
| White | 16 |
| Hispanic / Latino | 2 |
| Black / African American | 21 |
| Unknown | 1 |

Minority students account for 58% of Business Administration & Management doctoral degree recipients at St. John Fisher University, higher than the national average of 44%.*
*The racial-ethnic minorities figure is the total number of graduates minus White, international (nonresident), and unknown-race graduates.
More Specific Business Administration & Management Concentrations at St. John Fisher University
This Business Administration & Management program at St. John Fisher University offers more specialized concentrations:
| Concentration | Graduates |
|---|---|
| Business Administration & Management | 83 |
| Organizational Leadership | 40 |
Highest-Paying Careers for Business Administration & Management Graduates
Students who finish Business Administration & Management program at St. John Fisher University go on to a range of careers. Below are the top-paying careers for Business Administration & Management majors, ordered by median annual salary:
| Occupation | Nationwide Median Wage |
|---|---|
| Loss Prevention Managers | $165,723 |
| Geothermal Production Managers | $160,381 |
| Administrative Services Managers | $158,084 |
| Facilities Managers | $157,669 |
| Biomass Power Plant Managers | $146,025 |
| Supply Chain Managers | $138,103 |
| Medical and Health Services Managers | $129,557 |
| Security Management Specialists | $128,654 |
| Industrial Production Managers | $126,666 |
| Wind Energy Operations Managers | $122,567 |
References
- IPEDS — Integrated Postsecondary Education Data System
- U.S. Department of Education — College Scorecard
- O*NET Online (Bureau of Labor Statistics)
- National Center for Education Statistics
More about our data sources and methodologies.
BusinessDegreeCentral.com provides higher-education, college and university, degree, program, career, salary, and other helpful information to students, faculty, institutions, and other internet audiences. Presented information and data are subject to change. Inclusion on this website does not imply or represent a direct relationship with the company, school, or brand. Information, though believed correct at time of publication, may not be correct, and no warranty is provided. Contact the schools to verify any information before relying on it. Financial aid may be available for those who qualify. The displayed options may include sponsored or recommended results, not necessarily based on your preferences.
© BusinessDegreeCentral.com – All Rights Reserved.