Business Administration & Management at Post University
If you plan to study Business Administration & Management, consider the program at Post University. Get started with the following essential facts.
Post University sits in Waterbury, CT.
For the most recent IPEDS reporting year, 470 business administration & management graduations were recorded at Post University.
Featured schools near , edit
Online Class Availability at Post University
Many students take online classes at Post University. Of 16,178 students, 15,053 (93%) were enrolled entirely in distance education and 221 (1%) took at least some classes online.
Business Administration & Management Rankings at Post University
Rankings can help you compare Post University’s Business Administration & Management program against peer institutions.
Bachelor’s-Level Rankings
| Ranking | Scope | Rank |
|---|---|---|
| Best Value | Connecticut | #6 of 18 |
| Best Schools (Quality) | Connecticut | #17 of 18 |
| Best Value | New England (Region) | #54 of 124 |
| Best Schools (Quality) | New England (Region) | #104 of 125 |
| Best Value | Nationwide | #1280 of 1,983 |
| Best Schools (Quality) | Nationwide | #1356 of 2,012 |
Master’s-Level Rankings
| Ranking | Scope | Rank |
|---|---|---|
| Best Value | Connecticut | #6 of 18 |
| Best Schools (Quality) | Connecticut | #17 of 18 |
| Best Value | New England (Region) | #54 of 124 |
| Best Schools (Quality) | New England (Region) | #104 of 125 |
| Best Value | Nationwide | #1280 of 1,983 |
| Best Schools (Quality) | Nationwide | #1356 of 2,012 |
Associate-Level Rankings
| Ranking | Scope | Rank |
|---|---|---|
| Best Value | Connecticut | #6 of 18 |
| Best Schools (Quality) | Connecticut | #17 of 18 |
| Best Value | New England (Region) | #54 of 124 |
| Best Schools (Quality) | New England (Region) | #104 of 125 |
| Best Value | Nationwide | #1280 of 1,983 |
| Best Schools (Quality) | Nationwide | #1356 of 2,012 |
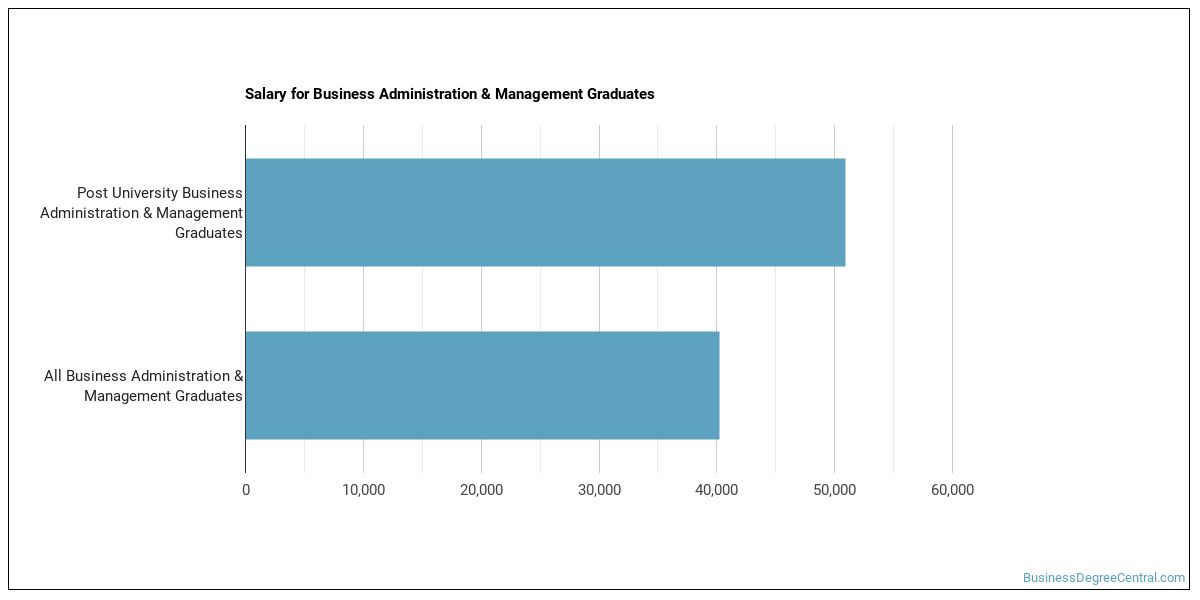
Earnings for Business Administration & Management Graduates from Post University
Graduates of Post University’s Business Administration & Management program report the following median earnings (per the U.S. Department of Education’s College Scorecard):
| Years After Graduation | Median Earnings |
|---|---|
| 1 year | $54,265 |
| 2 years | $51,844 |
| 3 years | $54,441 |
| 4 years | $61,219 |
| 5 years | $68,144 |
How does this compare to the school overall? Four years out, Business Administration & Management graduates from Post University earn a median of $61,219, compared with $52,990 for all Post University graduates — about 16% higher than the school-wide median.

Median Debt at Graduation
Typical debt at graduation for Business Administration & Management graduates from Post University comes in at $33,696.
Student Demographics & Diversity
The following sections describe the composition of Business Administration & Management graduates at Post University, by degree type.
Looking at the program as a whole, Business Administration & Management graduates at Post University are 34% women (159) and 66% men (311).
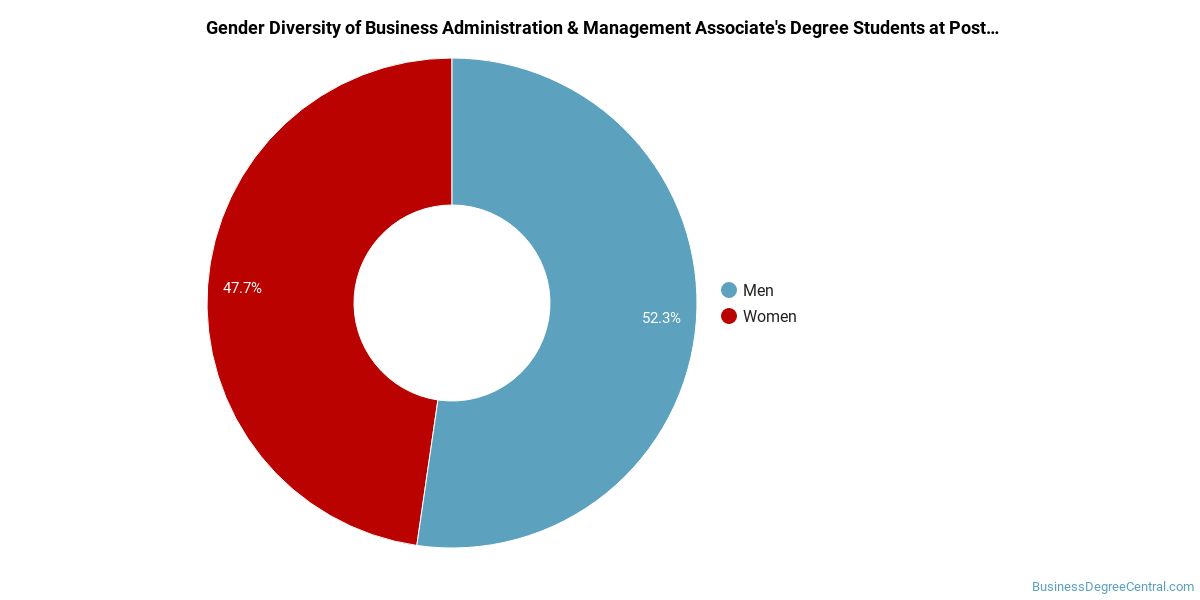
Business Administration & Management Associate’s Program at Post University
Among the 155 associate’s business administration & management graduates at Post University, 55% were women (86) and 45% were men (69).
The following table and chart show the race/ethnicity of Business Administration & Management associate’s degree recipients at Post University.
| Race / Ethnicity | Number of Graduates |
|---|---|
| White | 58 |
| Hispanic / Latino | 26 |
| Black / African American | 50 |
| Asian | 2 |
| Two or More Races | 16 |
| International (Nonresident) | 1 |
| Unknown | 2 |
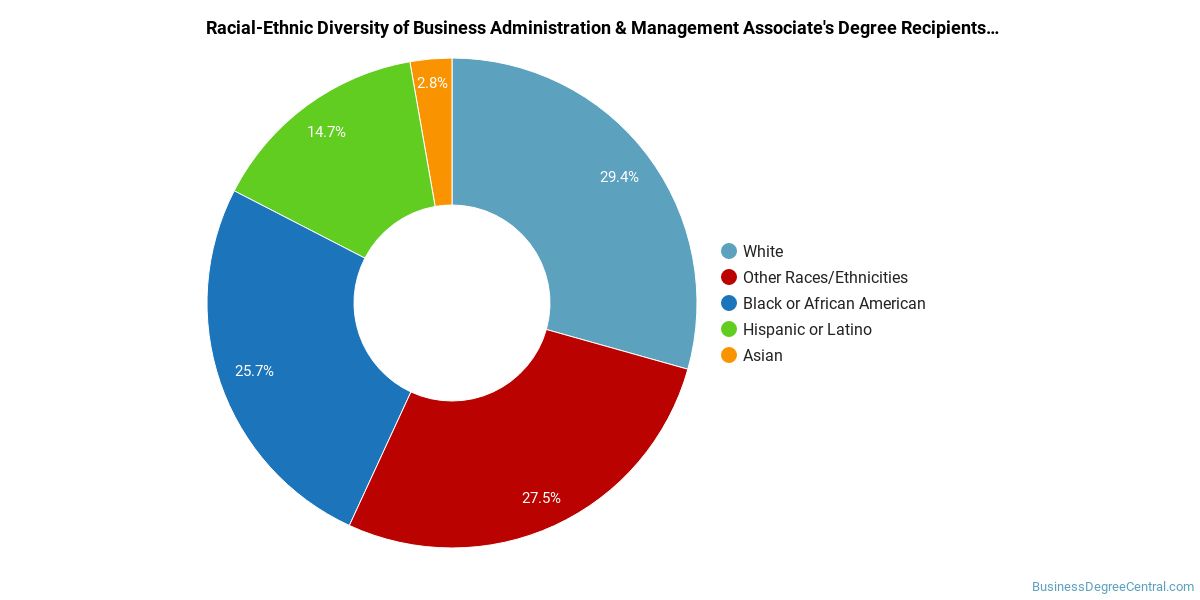
Racial-ethnic minorities make up 61% of Business Administration & Management associate’s degree recipients at Post University, above the national average of 51%.*
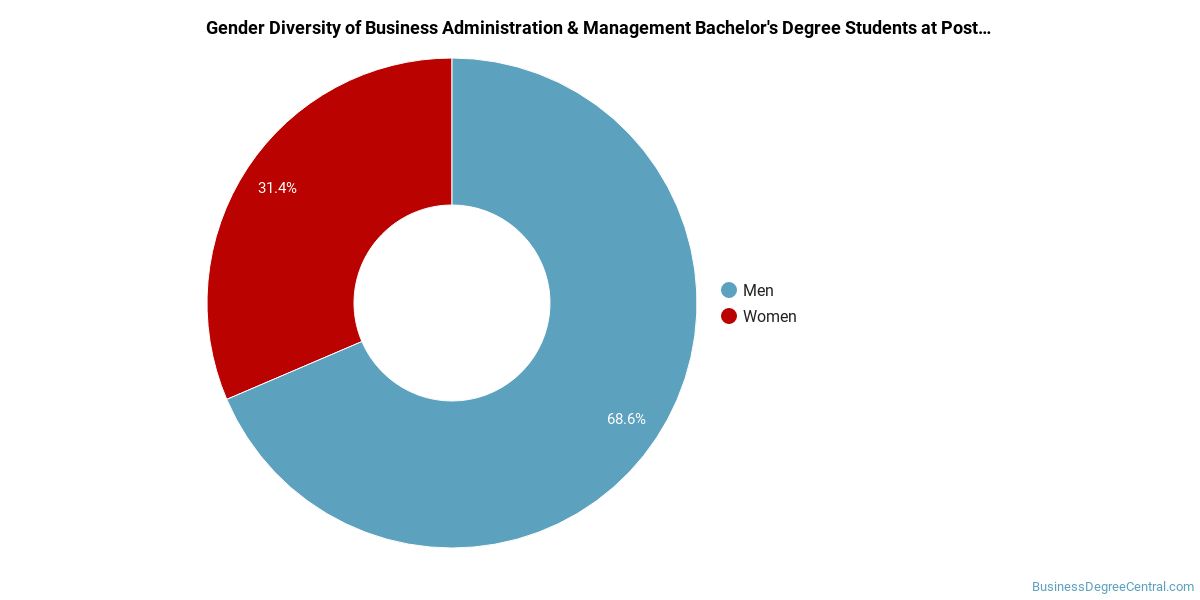
Business Administration & Management Bachelor’s Program at Post University
Among the 285 bachelor’s business administration & management graduates at Post University, 21% were women (60) and 79% were men (225).
The following table and chart show the race/ethnicity of Business Administration & Management bachelor’s degree recipients at Post University.
| Race / Ethnicity | Number of Graduates |
|---|---|
| White | 100 |
| Hispanic / Latino | 47 |
| Black / African American | 32 |
| Asian | 3 |
| American Indian / Alaska Native | 1 |
| Native Hawaiian / Pacific Islander | 1 |
| Two or More Races | 81 |
| International (Nonresident) | 13 |
| Unknown | 7 |
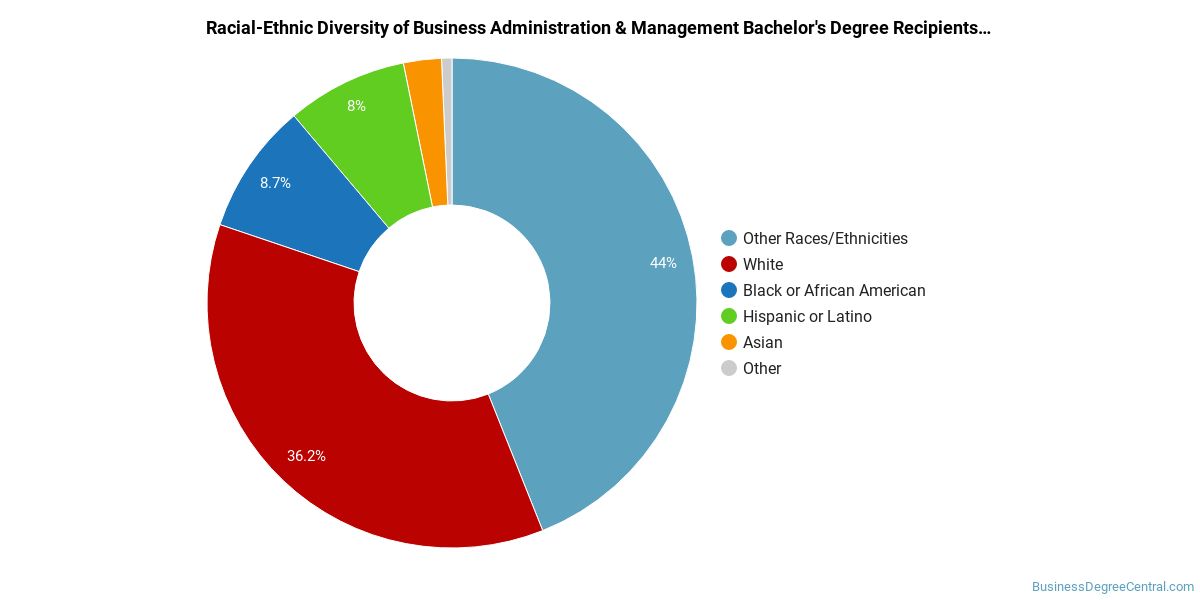
Racial-ethnic minorities make up 58% of Business Administration & Management bachelor’s degree recipients at Post University, above the national average of 41%.*
Business Administration & Management Master’s Program at Post University
Among the 30 master’s business administration & management graduates at Post University, 43% were women (13) and 57% were men (17).
The following table and chart show the race/ethnicity of Business Administration & Management master’s degree recipients at Post University.
| Race / Ethnicity | Number of Graduates |
|---|---|
| White | 12 |
| Hispanic / Latino | 6 |
| Black / African American | 3 |
| Asian | 1 |
| Two or More Races | 7 |
| International (Nonresident) | 1 |
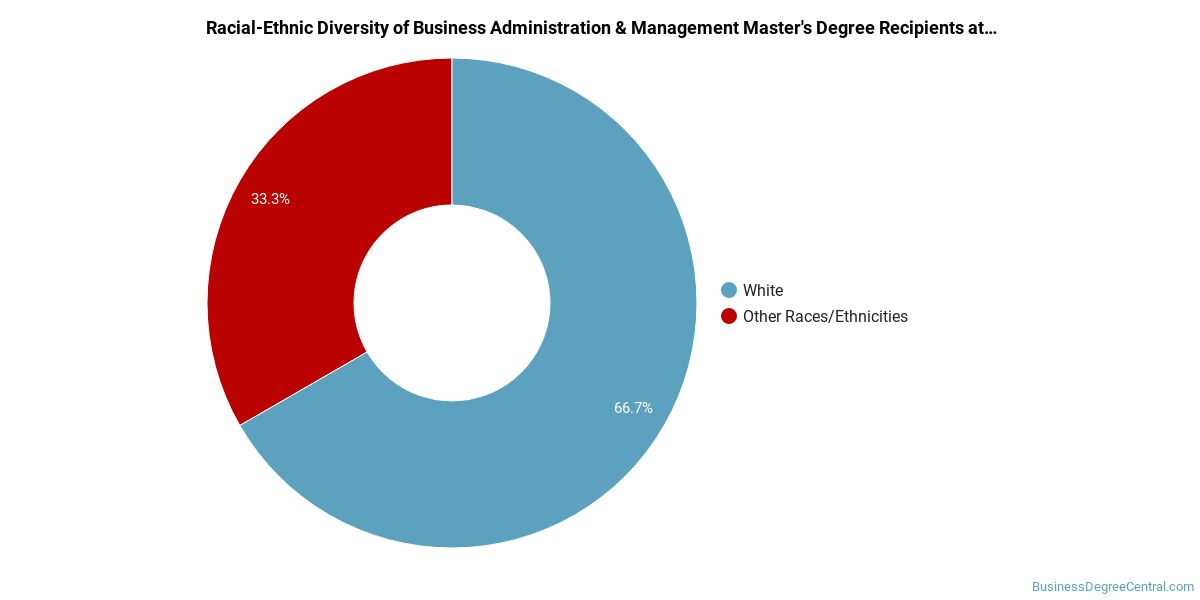
Minority students account for 57% of Business Administration & Management master’s degree recipients at Post University, above the national average of 36%.*
*The racial-ethnic minorities figure is the total number of graduates minus White, international (nonresident), and unknown-race graduates.
More Specific Business Administration & Management Concentrations at Post University
This Business Administration & Management program at Post University includes the following sub-specializations:
| Concentration | Graduates |
|---|---|
| Business Administration & Management | 440 |
| Project Management | 30 |
Highest-Paying Careers for Business Administration & Management Graduates
Graduates of the Business Administration & Management program at Post University pursue many career paths. The table below ranks the highest-paying careers for Business Administration & Management majors, ordered by median annual salary:
| Occupation | Nationwide Median Wage |
|---|---|
| Loss Prevention Managers | $165,723 |
| Geothermal Production Managers | $160,381 |
| Administrative Services Managers | $158,084 |
| Facilities Managers | $157,669 |
| Biomass Power Plant Managers | $146,025 |
| Supply Chain Managers | $138,103 |
| Medical and Health Services Managers | $129,557 |
| Security Management Specialists | $128,654 |
| Industrial Production Managers | $126,666 |
| Wind Energy Operations Managers | $122,567 |
References
- IPEDS — Integrated Postsecondary Education Data System
- U.S. Department of Education — College Scorecard
- O*NET Online (Bureau of Labor Statistics)
- National Center for Education Statistics
More about our data sources and methodologies.
BusinessDegreeCentral.com provides higher-education, college and university, degree, program, career, salary, and other helpful information to students, faculty, institutions, and other internet audiences. Presented information and data are subject to change. Inclusion on this website does not imply or represent a direct relationship with the company, school, or brand. Information, though believed correct at time of publication, may not be correct, and no warranty is provided. Contact the schools to verify any information before relying on it. Financial aid may be available for those who qualify. The displayed options may include sponsored or recommended results, not necessarily based on your preferences.
© BusinessDegreeCentral.com – All Rights Reserved.