Business Administration & Management at Morgan State University
What traits are you looking for in a school for Business Administration & Management, take a look at what Morgan State University. We’ve gathered the following information to help you decide.
Morgan State University is in Baltimore, MD.
During the most recent reporting year, 129 business administration & management degrees were awarded at Morgan State University.
Featured schools near , edit
Online Class Availability at Morgan State University
Many students take online classes at Morgan State University. Of 10,739 students, 656 (6%) studied exclusively online and 5,419 (50%) took at least some classes online.
Business Administration & Management Rankings at Morgan State University
Rankings can help you compare Morgan State University’s Business Administration & Management program against other schools offering the same major.
Bachelor’s-Level Rankings
| Ranking | Scope | Rank |
|---|---|---|
| Best Value | Maryland | #18 of 34 |
| Best Schools (Quality) | Maryland | #29 of 33 |
| Best Value | Middle Atlantic (Region) | #132 of 319 |
| Best Schools (Quality) | Middle Atlantic (Region) | #274 of 326 |
| Best Value | Nationwide | #1071 of 1,983 |
| Best Schools (Quality) | Nationwide | #1612 of 2,012 |
Master’s-Level Rankings
| Ranking | Scope | Rank |
|---|---|---|
| Best Value | Maryland | #18 of 34 |
| Best Schools (Quality) | Maryland | #29 of 33 |
| Best Value | Middle Atlantic (Region) | #132 of 319 |
| Best Schools (Quality) | Middle Atlantic (Region) | #274 of 326 |
| Best Value | Nationwide | #1071 of 1,983 |
| Best Schools (Quality) | Nationwide | #1612 of 2,012 |
Doctoral-Level Rankings
| Ranking | Scope | Rank |
|---|---|---|
| Best Value | Maryland | #18 of 34 |
| Best Schools (Quality) | Maryland | #29 of 33 |
| Best Value | Middle Atlantic (Region) | #132 of 319 |
| Best Schools (Quality) | Middle Atlantic (Region) | #274 of 326 |
| Best Value | Nationwide | #1071 of 1,983 |
| Best Schools (Quality) | Nationwide | #1612 of 2,012 |
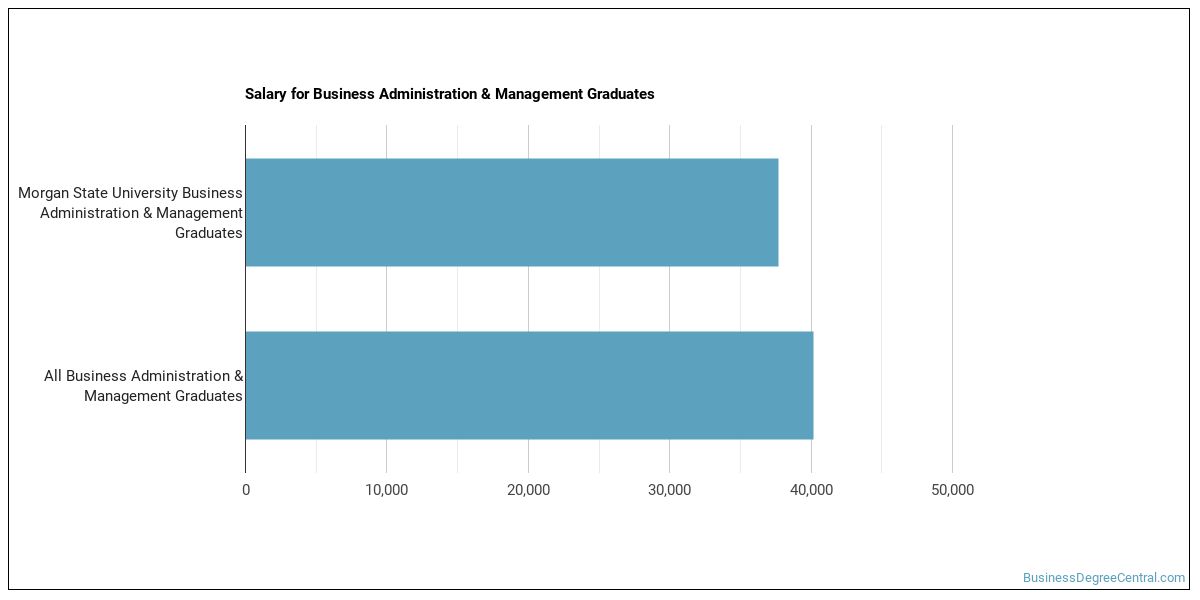
Earnings for Business Administration & Management Graduates from Morgan State University
Students who complete Morgan State University’s Business Administration & Management program earn the following amounts (per the U.S. Department of Education’s College Scorecard):
| Years After Graduation | Median Earnings |
|---|---|
| 1 year | $45,328 |
| 2 years | $44,974 |
| 3 years | $49,224 |
| 4 years | $58,798 |
| 5 years | $64,664 |
How does this compare to the school overall? Four years after graduating, Business Administration & Management graduates from Morgan State University earn a median of $58,798, compared with $58,575 for all Morgan State University graduates — about 0% higher than the school-wide median.

Median Debt at Graduation
Typical debt at graduation for Business Administration & Management graduates from Morgan State University comes in at $31,000.
Student Demographics & Diversity
The following sections describe the student demographics for Business Administration & Management graduates at Morgan State University, by degree type.
Program-wide, Business Administration & Management graduates at Morgan State University are 63% women (81) and 37% men (48).
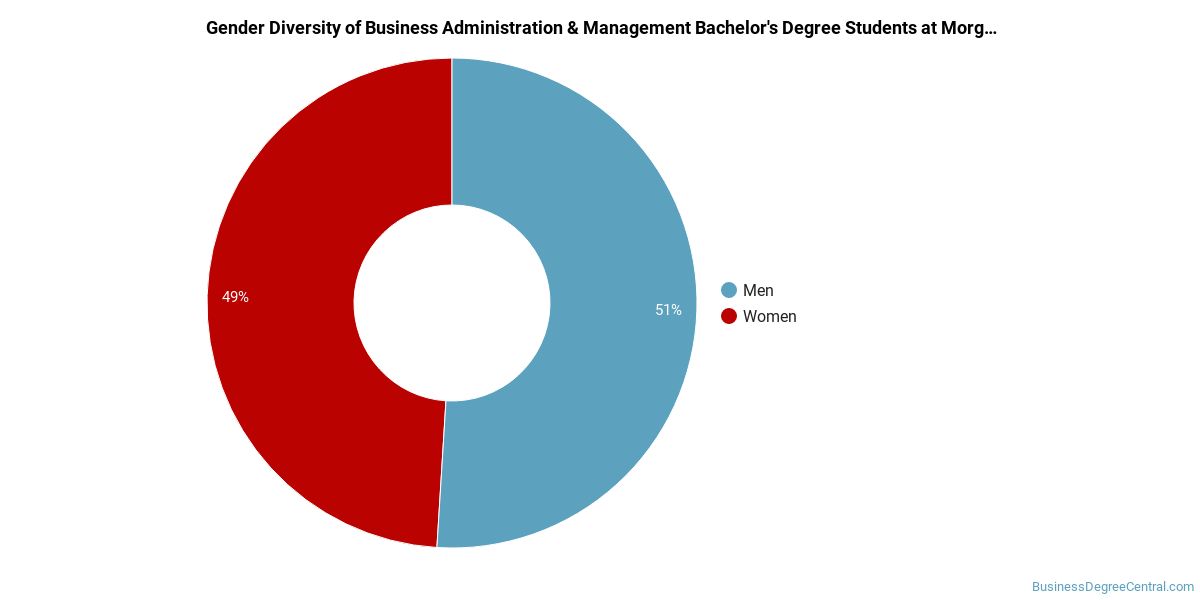
Business Administration & Management Bachelor’s Program at Morgan State University
Among the 87 bachelor’s business administration & management degrees awarded at Morgan State University, 72% were women (63) and 28% were men (24).
The following table and chart show the race/ethnicity of Business Administration & Management bachelor’s degree recipients at Morgan State University.
| Race / Ethnicity | Number of Graduates |
|---|---|
| White | 1 |
| Hispanic / Latino | 3 |
| Black / African American | 75 |
| Two or More Races | 1 |
| International (Nonresident) | 4 |
| Unknown | 3 |
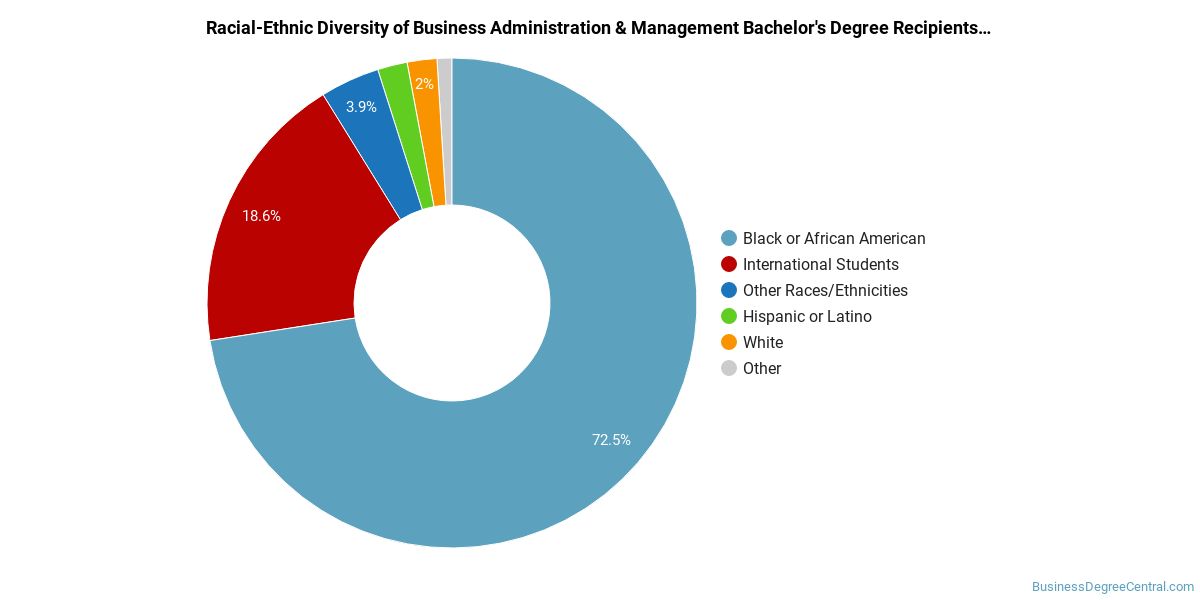
Racial-ethnic minorities make up 91% of Business Administration & Management bachelor’s degree recipients at Morgan State University, above the national average of 41%.*
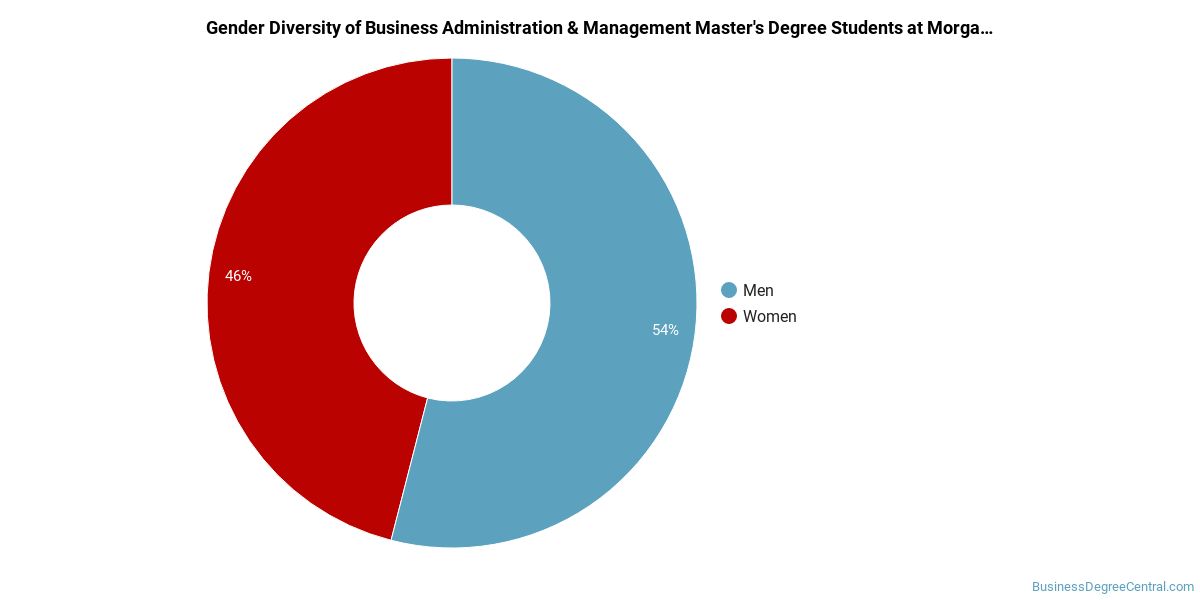
Business Administration & Management Master’s Program at Morgan State University
Among the 39 master’s business administration & management degrees awarded at Morgan State University, 44% were women (17) and 56% were men (22).
The following table and chart show the race/ethnicity of Business Administration & Management master’s degree recipients at Morgan State University.
| Race / Ethnicity | Number of Graduates |
|---|---|
| White | 1 |
| Hispanic / Latino | 4 |
| Black / African American | 23 |
| International (Nonresident) | 11 |
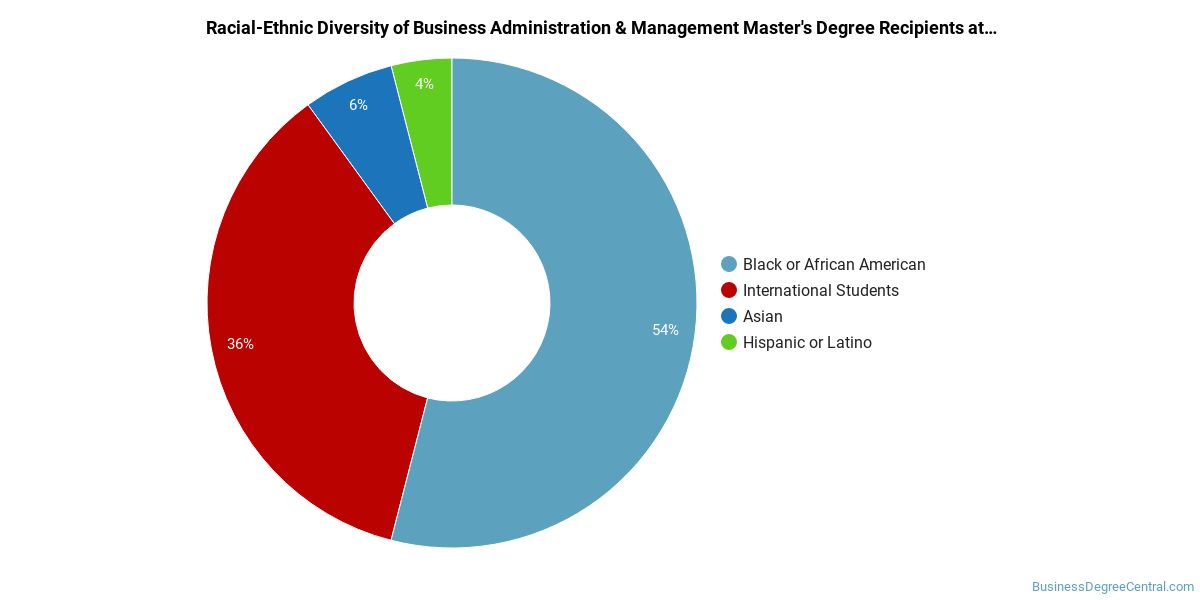
Minority students account for 69% of Business Administration & Management master’s degree recipients at Morgan State University, above the national average of 36%.*
Business Administration & Management Doctoral Program at Morgan State University
Among the 3 doctoral business administration & management degrees awarded at Morgan State University, 33% were women (1) and 67% were men (2).

The following table and chart show the race/ethnicity of Business Administration & Management doctoral degree recipients at Morgan State University.
| Race / Ethnicity | Number of Graduates |
|---|---|
| International (Nonresident) | 3 |

*The racial-ethnic minorities figure is the total number of graduates minus White, international (nonresident), and unknown-race graduates.
More Specific Business Administration & Management Concentrations at Morgan State University
This Business Administration & Management program at Morgan State University includes the following sub-specializations:
| Concentration | Graduates |
|---|---|
| Business Administration & Management | 118 |
| Supply Chain Management | 4 |
| Operations Management | 7 |
Highest-Paying Careers for Business Administration & Management Graduates
Graduates of the Business Administration & Management program at Morgan State University pursue many career paths. The table below ranks the top-paying careers for Business Administration & Management majors, ordered by median annual salary:
| Occupation | Nationwide Median Wage |
|---|---|
| Loss Prevention Managers | $165,723 |
| Geothermal Production Managers | $160,381 |
| Administrative Services Managers | $158,084 |
| Facilities Managers | $157,669 |
| Biomass Power Plant Managers | $146,025 |
| Supply Chain Managers | $138,103 |
| Medical and Health Services Managers | $129,557 |
| Security Management Specialists | $128,654 |
| Industrial Production Managers | $126,666 |
| Wind Energy Operations Managers | $122,567 |
References
- IPEDS — Integrated Postsecondary Education Data System
- U.S. Department of Education — College Scorecard
- O*NET Online (Bureau of Labor Statistics)
- National Center for Education Statistics
More about our data sources and methodologies.
BusinessDegreeCentral.com provides higher-education, college and university, degree, program, career, salary, and other helpful information to students, faculty, institutions, and other internet audiences. Presented information and data are subject to change. Inclusion on this website does not imply or represent a direct relationship with the company, school, or brand. Information, though believed correct at time of publication, may not be correct, and no warranty is provided. Contact the schools to verify any information before relying on it. Financial aid may be available for those who qualify. The displayed options may include sponsored or recommended results, not necessarily based on your preferences.
© BusinessDegreeCentral.com – All Rights Reserved.