Business Administration & Management at Linfield University
If you plan to study Business Administration & Management, you may want to check out the program at Linfield University. The following information will help you decide if it is a good fit for you.
Linfield University is in McMinnville, OR.
For the most recent IPEDS reporting year, 37 business administration & management degrees were awarded at Linfield University.
Featured schools near , edit
Online Class Availability at Linfield University
Online coursework is an option at Linfield University. Among 1,709 students, 105 (6%) were enrolled entirely in distance education and 286 (17%) took at least some classes online.
Business Administration & Management Rankings at Linfield University
These rankings give you a sense of how Linfield University’s Business Administration & Management program against other schools offering the same major.
Bachelor’s-Level Rankings
| Ranking | Scope | Rank |
|---|---|---|
| Best Schools (Quality) | Oregon | #14 of 25 |
| Best Value | Oregon | #21 of 24 |
| Best Schools (Quality) | Far Western (Region) | #200 of 274 |
| Best Value | Far Western (Region) | #232 of 266 |
| Best Schools (Quality) | Nationwide | #1192 of 2,012 |
| Best Value | Nationwide | #1750 of 1,983 |
Earnings for Business Administration & Management Graduates from Linfield University
Those who finish Linfield University’s Business Administration & Management program earn the following amounts (per the U.S. Department of Education’s College Scorecard):
| Years After Graduation | Median Earnings |
|---|---|
| 1 year | $42,143 |
Median Debt at Graduation
The median debt for Business Administration & Management graduates from Linfield University is $27,000.
Student Demographics & Diversity
The following sections describe the student demographics for Business Administration & Management graduates at Linfield University, by degree type.
Across all degree levels, Business Administration & Management graduates at Linfield University are 27% women (10) and 73% men (27).
Business Administration & Management Bachelor’s Program at Linfield University
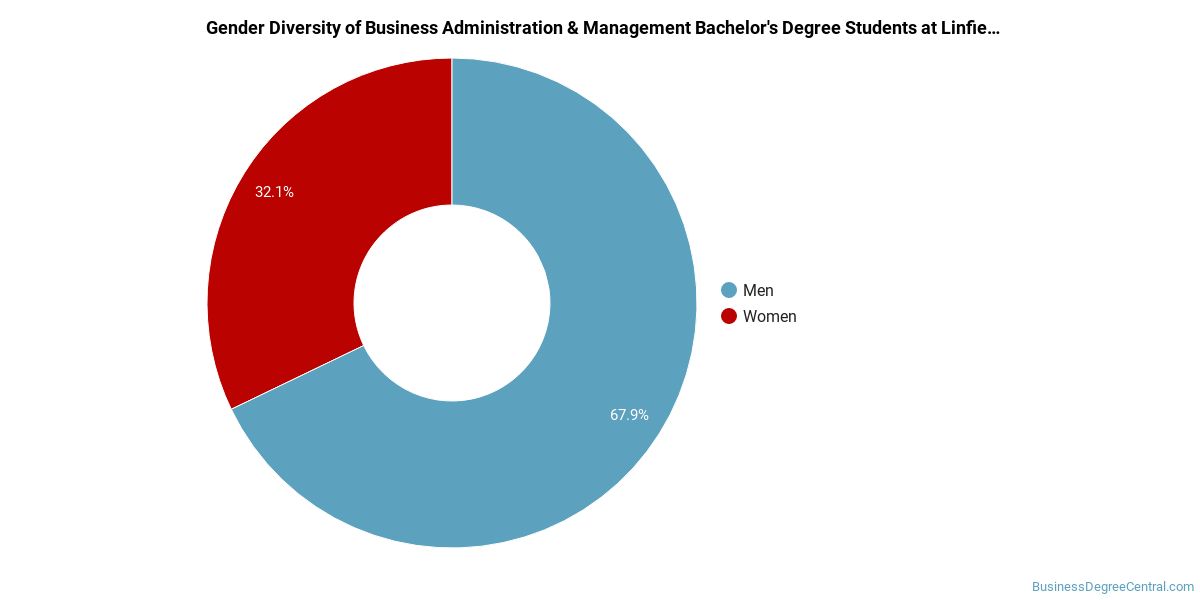
Among the 28 bachelor’s business administration & management graduates at Linfield University, 29% were women (8) and 71% were men (20).
The following table and chart show the race/ethnicity of Business Administration & Management bachelor’s degree recipients at Linfield University.
| Race / Ethnicity | Number of Graduates |
|---|---|
| White | 21 |
| Hispanic / Latino | 5 |
| International (Nonresident) | 1 |
| Unknown | 1 |
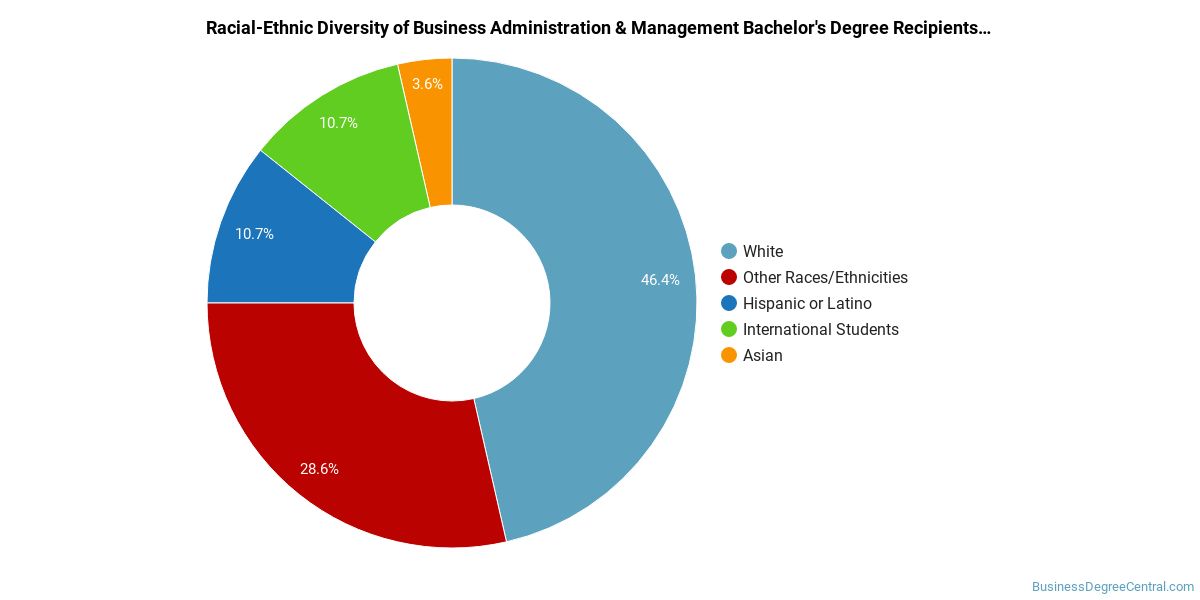
Minority students account for 18% of Business Administration & Management bachelor’s degree recipients at Linfield University, lower than the national average of 41%.*
Business Administration & Management Master’s Program at Linfield University
Among the 8 master’s business administration & management graduates at Linfield University, 25% were women (2) and 75% were men (6).

The following table and chart show the race/ethnicity of Business Administration & Management master’s degree recipients at Linfield University.
| Race / Ethnicity | Number of Graduates |
|---|---|
| White | 5 |
| Hispanic / Latino | 1 |
| Asian | 1 |
| Two or More Races | 1 |

Racial-ethnic minorities make up 38% of Business Administration & Management master’s degree recipients at Linfield University, higher than the national average of 36%.*
*The racial-ethnic minorities figure is the total number of graduates minus White, international (nonresident), and unknown-race graduates.
More Specific Business Administration & Management Concentrations at Linfield University
The Business Administration & Management program at Linfield University offers more specialized concentrations:
| Concentration | Graduates |
|---|---|
| Business Administration & Management | 28 |
| Project Management | 1 |
| Organizational Leadership | 8 |
Highest-Paying Careers for Business Administration & Management Graduates
Those who complete Business Administration & Management program at Linfield University pursue many career paths. Below are the highest-paying careers for Business Administration & Management majors, ordered by median annual salary:
| Occupation | Nationwide Median Wage |
|---|---|
| Loss Prevention Managers | $165,723 |
| Geothermal Production Managers | $160,381 |
| Administrative Services Managers | $158,084 |
| Facilities Managers | $157,669 |
| Biomass Power Plant Managers | $146,025 |
| Supply Chain Managers | $138,103 |
| Medical and Health Services Managers | $129,557 |
| Security Management Specialists | $128,654 |
| Industrial Production Managers | $126,666 |
| Wind Energy Operations Managers | $122,567 |
References
- IPEDS — Integrated Postsecondary Education Data System
- U.S. Department of Education — College Scorecard
- O*NET Online (Bureau of Labor Statistics)
- National Center for Education Statistics
More about our data sources and methodologies.
BusinessDegreeCentral.com provides higher-education, college and university, degree, program, career, salary, and other helpful information to students, faculty, institutions, and other internet audiences. Presented information and data are subject to change. Inclusion on this website does not imply or represent a direct relationship with the company, school, or brand. Information, though believed correct at time of publication, may not be correct, and no warranty is provided. Contact the schools to verify any information before relying on it. Financial aid may be available for those who qualify. The displayed options may include sponsored or recommended results, not necessarily based on your preferences.
© BusinessDegreeCentral.com – All Rights Reserved.