Finance at Lindenwood University
What traits are you looking for in a school for Finance, take a look at what Lindenwood University. We’ve gathered the following information to help you decide.
Lindenwood University is in Saint Charles, MO.
During the most recent reporting year, 32 finance degrees were awarded at Lindenwood University.
Featured schools near , edit
Online & Distance Learning at Lindenwood University
Online coursework is an option at Lindenwood University. Of 6,826 students, 3,177 (47%) were enrolled entirely in distance education and 2,994 (44%) took at least some classes online.
Finance Rankings at Lindenwood University
Use these rankings to compare Lindenwood University’s Finance program against other schools offering the same major.
Bachelor’s-Level Rankings
| Ranking | Scope | Rank |
|---|---|---|
| Best Value | Missouri | #6 of 11 |
| Best Schools (Quality) | Missouri | #10 of 11 |
| Best Value | The Plains States (Region) | #27 of 54 |
| Best Schools (Quality) | The Plains States (Region) | #44 of 53 |
| Best Value | Nationwide | #272 of 532 |
| Best Schools (Quality) | Nationwide | #423 of 525 |
Master’s-Level Rankings
| Ranking | Scope | Rank |
|---|---|---|
| Best Value | Missouri | #6 of 11 |
| Best Schools (Quality) | Missouri | #10 of 11 |
| Best Value | The Plains States (Region) | #27 of 54 |
| Best Schools (Quality) | The Plains States (Region) | #44 of 53 |
| Best Value | Nationwide | #272 of 532 |
| Best Schools (Quality) | Nationwide | #423 of 525 |
Student Demographics & Diversity
Take a look at the diversity of Finance graduates at Lindenwood University, by degree type.
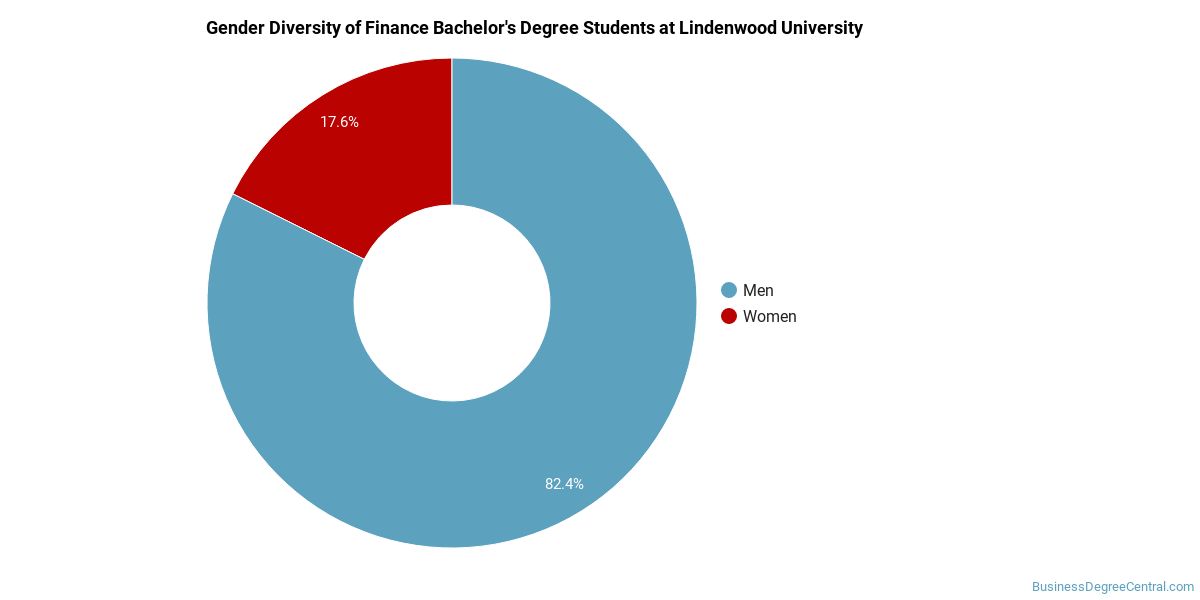
Looking at the program as a whole, Finance graduates at Lindenwood University are 19% women (6) and 81% men (26).
Finance Bachelor’s Program at Lindenwood University
Of the 32 bachelor’s finance graduates at Lindenwood University, 19% were women (6) and 81% were men (26).
The following table and chart show the race/ethnicity of Finance bachelor’s degree recipients at Lindenwood University.
| Race / Ethnicity | Number of Graduates |
|---|---|
| White | 20 |
| Hispanic / Latino | 1 |
| Black / African American | 2 |
| Asian | 2 |
| International (Nonresident) | 6 |
| Unknown | 1 |
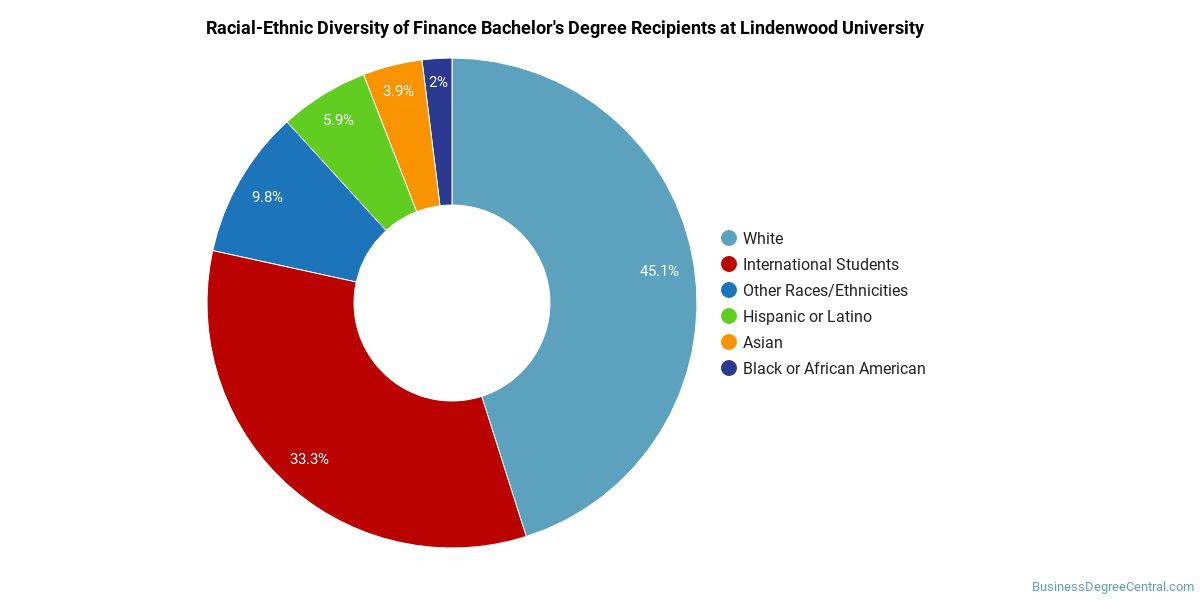
Racial-ethnic minorities make up 16% of Finance bachelor’s degree recipients at Lindenwood University, below the national average of 29%.*
*The racial-ethnic minorities figure is the total number of graduates minus White, international (nonresident), and unknown-race graduates.
Best-Paid Careers for Finance Graduates
Graduates of the Finance program at Lindenwood University pursue many career paths. The table below ranks the highest-paying careers for Finance graduates, ordered by median annual salary:
| Occupation | Nationwide Median Wage |
|---|---|
| Treasurers and Controllers | $162,461 |
| Investment Fund Managers | $157,819 |
| General and Operations Managers | $149,694 |
| Chief Executives | $138,534 |
| Financial Risk Specialists | $127,364 |
| Financial Quantitative Analysts | $126,371 |
| Appraisers of Personal and Business Property | $118,242 |
| Chief Sustainability Officers | $96,628 |
| Fraud Examiners, Investigators and Analysts | $92,240 |
| Personal Financial Advisors | $91,777 |
References
- IPEDS — Integrated Postsecondary Education Data System
- U.S. Department of Education — College Scorecard
- O*NET Online (Bureau of Labor Statistics)
- National Center for Education Statistics
More about our data sources and methodologies.
BusinessDegreeCentral.com provides higher-education, college and university, degree, program, career, salary, and other helpful information to students, faculty, institutions, and other internet audiences. Presented information and data are subject to change. Inclusion on this website does not imply or represent a direct relationship with the company, school, or brand. Information, though believed correct at time of publication, may not be correct, and no warranty is provided. Contact the schools to verify any information before relying on it. Financial aid may be available for those who qualify. The displayed options may include sponsored or recommended results, not necessarily based on your preferences.
© BusinessDegreeCentral.com – All Rights Reserved.