General Hospitality Management at DePaul University
What traits are you looking for in a school for General Hospitality Management, take a look at what DePaul University. The following information will help you decide if it is a good fit for you.
DePaul University sits in Chicago, IL.
During the most recent reporting year, 15 general hospitality management degrees were awarded at DePaul University.
Featured schools near , edit
Studying Online at DePaul University
Distance learning is available at DePaul University. Among 21,210 students, 2,424 (11%) were enrolled entirely in distance education and 9,056 (43%) took at least some classes online.
General Hospitality Management Rankings at DePaul University
These rankings give you a sense of how DePaul University’s General Hospitality Management program against peer institutions.
Bachelor’s-Level Rankings
| Ranking | Scope | Rank |
|---|---|---|
| Best Schools (Quality) | Illinois | #1 of 5 |
| Best Schools (Quality) | Great Lakes (Region) | #2 of 13 |
| Best Value | Illinois | #5 of 5 |
| Best Value | Great Lakes (Region) | #18 of 18 |
| Best Schools (Quality) | Nationwide | #38 of 135 |
| Best Value | Nationwide | #154 of 166 |
Master’s-Level Rankings
| Ranking | Scope | Rank |
|---|---|---|
| Best Schools (Quality) | Illinois | #1 of 5 |
| Best Schools (Quality) | Great Lakes (Region) | #2 of 13 |
| Best Value | Illinois | #5 of 5 |
| Best Value | Great Lakes (Region) | #18 of 18 |
| Best Schools (Quality) | Nationwide | #38 of 135 |
| Best Value | Nationwide | #154 of 166 |
Student Demographics & Diversity
Below you’ll find the student demographics for General Hospitality Management graduates at DePaul University, broken down by degree level.
Across all degree levels, General Hospitality Management graduates at DePaul University are 73% women (11) and 27% men (4).
General Hospitality Management Bachelor’s Program at DePaul University
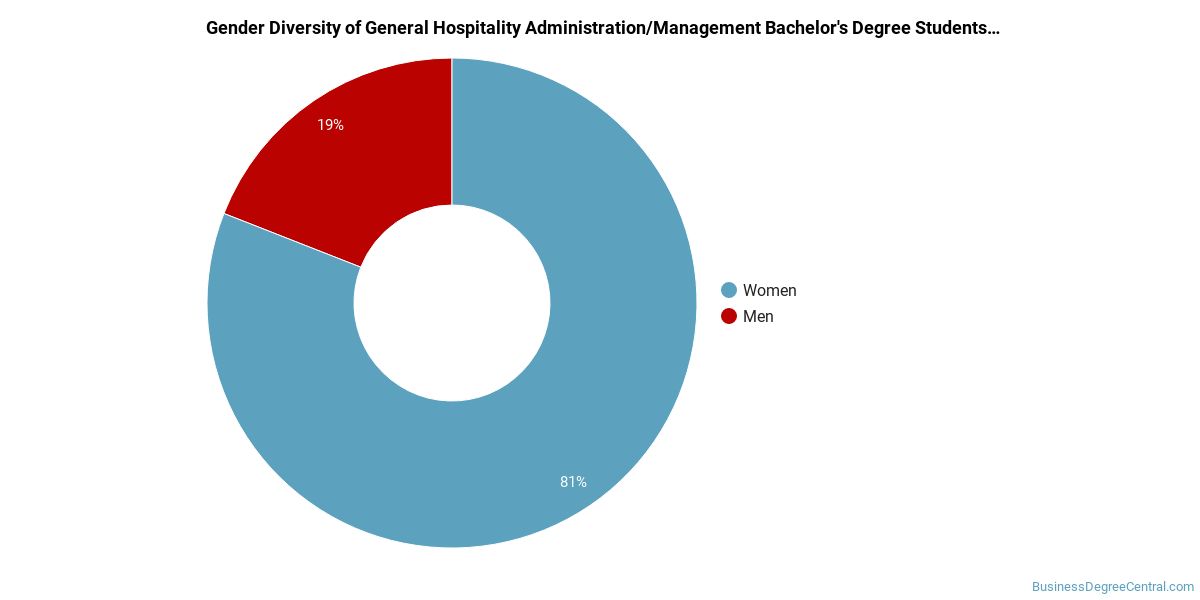
Of the 10 bachelor’s general hospitality management graduates at DePaul University, 70% were women (7) and 30% were men (3).
The following table and chart show the race/ethnicity of General Hospitality Management bachelor’s degree recipients at DePaul University.
| Race / Ethnicity | Number of Graduates |
|---|---|
| White | 2 |
| Hispanic / Latino | 2 |
| Black / African American | 1 |
| Asian | 4 |
| Two or More Races | 1 |
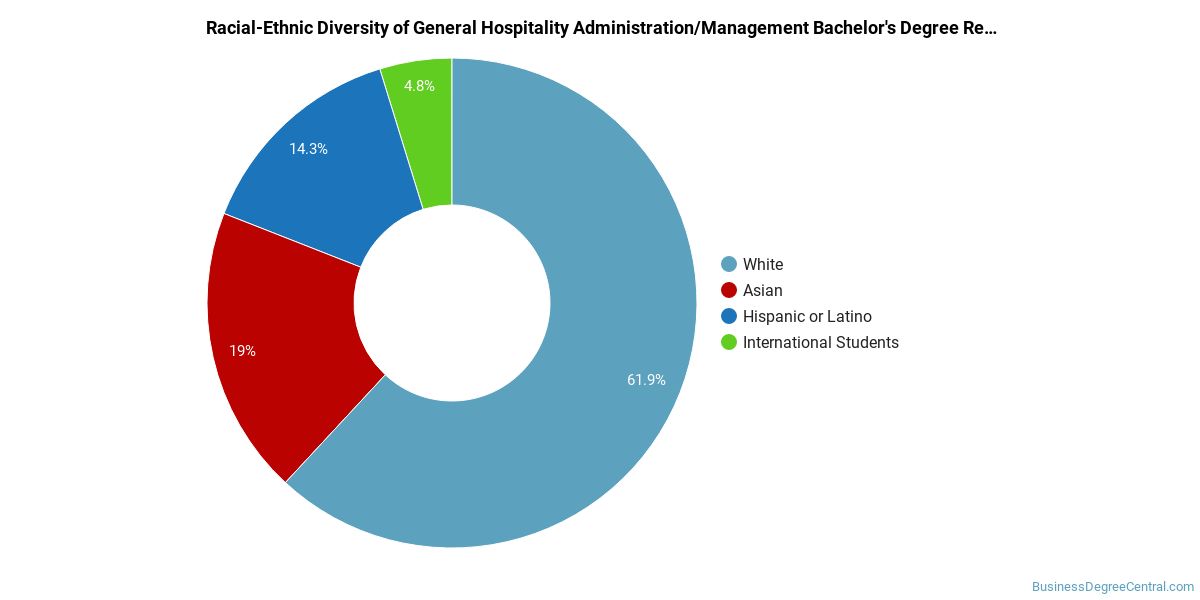
Minority students account for 80% of General Hospitality Management bachelor’s degree recipients at DePaul University, higher than the national average of 32%.*
General Hospitality Management Master’s Program at DePaul University
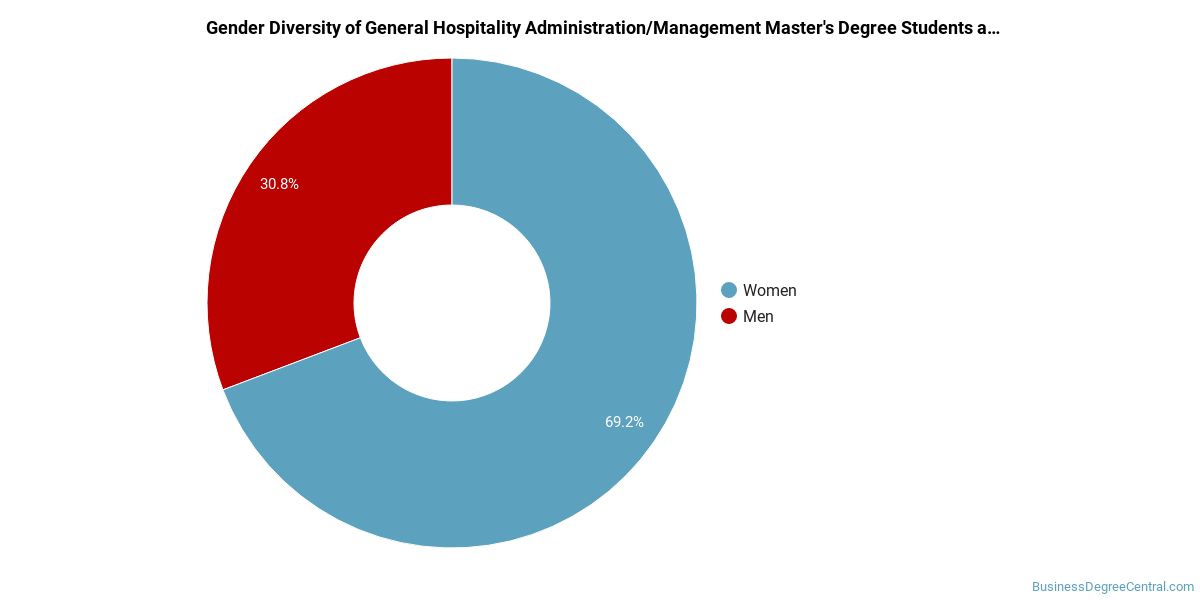
Among the 5 master’s general hospitality management graduates at DePaul University, 80% were women (4) and 20% were men (1).
The following table and chart show the race/ethnicity of General Hospitality Management master’s degree recipients at DePaul University.
| Race / Ethnicity | Number of Graduates |
|---|---|
| White | 1 |
| Black / African American | 1 |
| International (Nonresident) | 2 |
| Unknown | 1 |
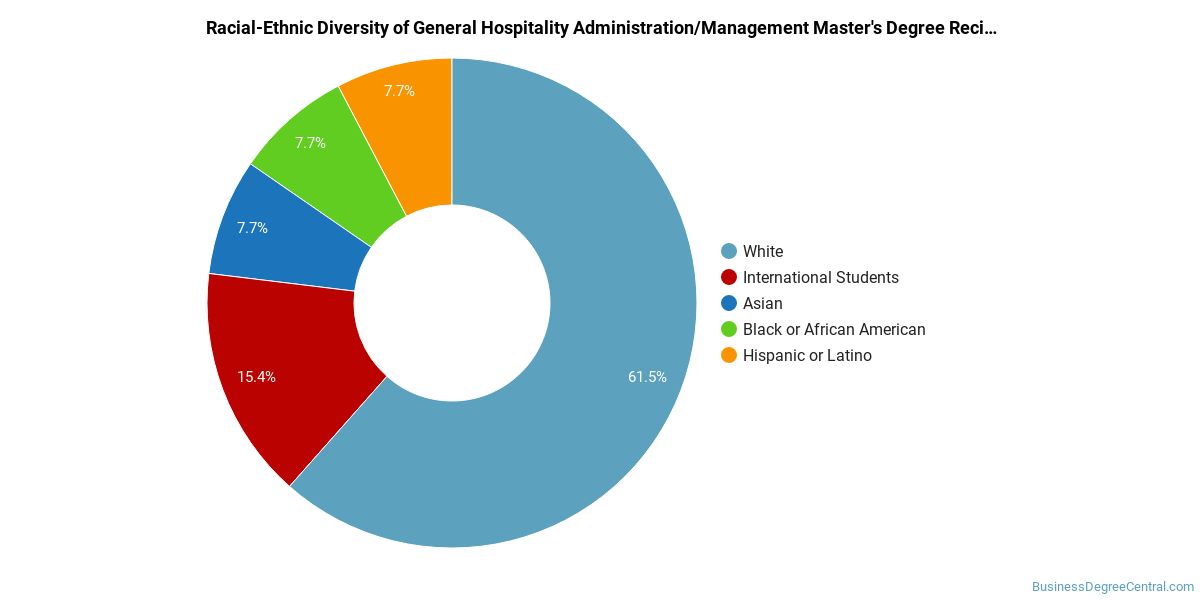
Racial-ethnic minorities make up 20% of General Hospitality Management master’s degree recipients at DePaul University, below the national average of 35%.*
*The racial-ethnic minorities figure is the total number of graduates minus White, international (nonresident), and unknown-race graduates.
Highest-Paying Careers for General Hospitality Management Graduates
Those who complete General Hospitality Management program at DePaul University work across a variety of fields. The table below ranks the best-paid careers for General Hospitality Management graduates, ordered by median annual salary:
| Occupation | Nationwide Median Wage |
|---|---|
| Entertainment and Recreation Managers, Except Gambling | $170,172 |
| Food Service Managers | $165,782 |
| Lodging Managers | $95,461 |
References
- IPEDS — Integrated Postsecondary Education Data System
- U.S. Department of Education — College Scorecard
- O*NET Online (Bureau of Labor Statistics)
- National Center for Education Statistics
More about our data sources and methodologies.
BusinessDegreeCentral.com provides higher-education, college and university, degree, program, career, salary, and other helpful information to students, faculty, institutions, and other internet audiences. Presented information and data are subject to change. Inclusion on this website does not imply or represent a direct relationship with the company, school, or brand. Information, though believed correct at time of publication, may not be correct, and no warranty is provided. Contact the schools to verify any information before relying on it. Financial aid may be available for those who qualify. The displayed options may include sponsored or recommended results, not necessarily based on your preferences.
© BusinessDegreeCentral.com – All Rights Reserved.