Business Administration & Management at Colorado Technical University-Colorado Springs
If you plan to study Business Administration & Management, take a look at what Colorado Technical University-Colorado Springs. The following information will help you decide if it is a good fit for you.
Colorado Technical University-Colorado Springs is in Colorado Springs, CO.
For the most recent IPEDS reporting year, 4,324 business administration & management graduations were recorded at Colorado Technical University-Colorado Springs.
Featured schools near , edit
Studying Online at Colorado Technical University-Colorado Springs
Many students take online classes at Colorado Technical University-Colorado Springs. Of 31,830 students, 31,486 (99%) studied exclusively online and 338 (1%) took at least some classes online.
Business Administration & Management Rankings at Colorado Technical University-Colorado Springs
These rankings give you a sense of how Colorado Technical University-Colorado Springs’s Business Administration & Management program to other colleges that offer this major.
Bachelor’s-Level Rankings
| Ranking | Scope | Rank |
|---|---|---|
| Best Value | Colorado | #13 of 22 |
| Best Schools (Quality) | Colorado | #21 of 23 |
| Best Value | Rocky Mountains (Region) | #37 of 57 |
| Best Schools (Quality) | Rocky Mountains (Region) | #55 of 58 |
| Best Value | Nationwide | #1093 of 1,983 |
| Best Schools (Quality) | Nationwide | #1726 of 2,012 |
Master’s-Level Rankings
| Ranking | Scope | Rank |
|---|---|---|
| Best Value | Colorado | #13 of 22 |
| Best Schools (Quality) | Colorado | #21 of 23 |
| Best Value | Rocky Mountains (Region) | #37 of 57 |
| Best Schools (Quality) | Rocky Mountains (Region) | #55 of 58 |
| Best Value | Nationwide | #1093 of 1,983 |
| Best Schools (Quality) | Nationwide | #1726 of 2,012 |
Doctoral-Level Rankings
| Ranking | Scope | Rank |
|---|---|---|
| Best Value | Colorado | #13 of 22 |
| Best Schools (Quality) | Colorado | #21 of 23 |
| Best Value | Rocky Mountains (Region) | #37 of 57 |
| Best Schools (Quality) | Rocky Mountains (Region) | #55 of 58 |
| Best Value | Nationwide | #1093 of 1,983 |
| Best Schools (Quality) | Nationwide | #1726 of 2,012 |
Associate-Level Rankings
| Ranking | Scope | Rank |
|---|---|---|
| Best Value | Colorado | #13 of 22 |
| Best Schools (Quality) | Colorado | #21 of 23 |
| Best Value | Rocky Mountains (Region) | #37 of 57 |
| Best Schools (Quality) | Rocky Mountains (Region) | #55 of 58 |
| Best Value | Nationwide | #1093 of 1,983 |
| Best Schools (Quality) | Nationwide | #1726 of 2,012 |
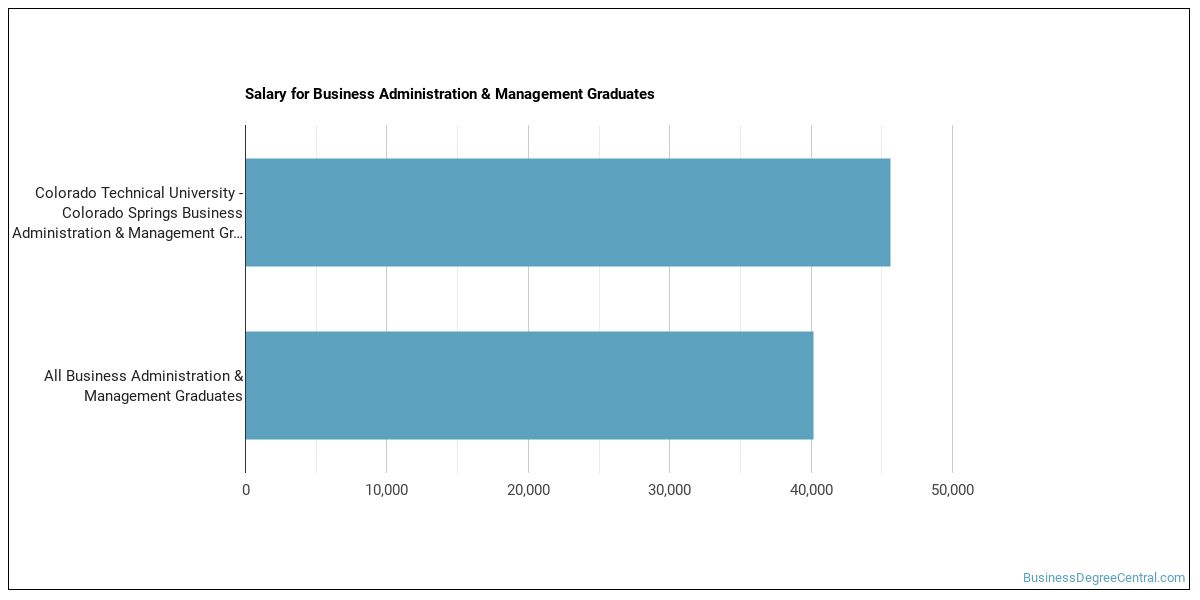
Earnings for Business Administration & Management Graduates from Colorado Technical University-Colorado Springs
Graduates of Colorado Technical University-Colorado Springs’s Business Administration & Management program report the following median earnings (per the U.S. Department of Education’s College Scorecard):
| Years After Graduation | Median Earnings |
|---|---|
| 1 year | $40,884 |
| 2 years | $40,406 |
| 3 years | $38,715 |
| 4 years | $47,370 |
| 5 years | $58,290 |
How does this compare to the school overall? Four years after graduating, Business Administration & Management graduates from Colorado Technical University-Colorado Springs take home a median $47,370, compared with $56,019 for all Colorado Technical University-Colorado Springs graduates — about 15% lower than the school-wide median.

Median Debt at Graduation
Typical debt at graduation for Business Administration & Management graduates from Colorado Technical University-Colorado Springs stands at $34,192.
Student Demographics & Diversity
Take a look at the student demographics for Business Administration & Management graduates at Colorado Technical University-Colorado Springs, broken down by degree level.
Looking at the program as a whole, Business Administration & Management graduates at Colorado Technical University-Colorado Springs are 67% women (2,904) and 33% men (1,420).
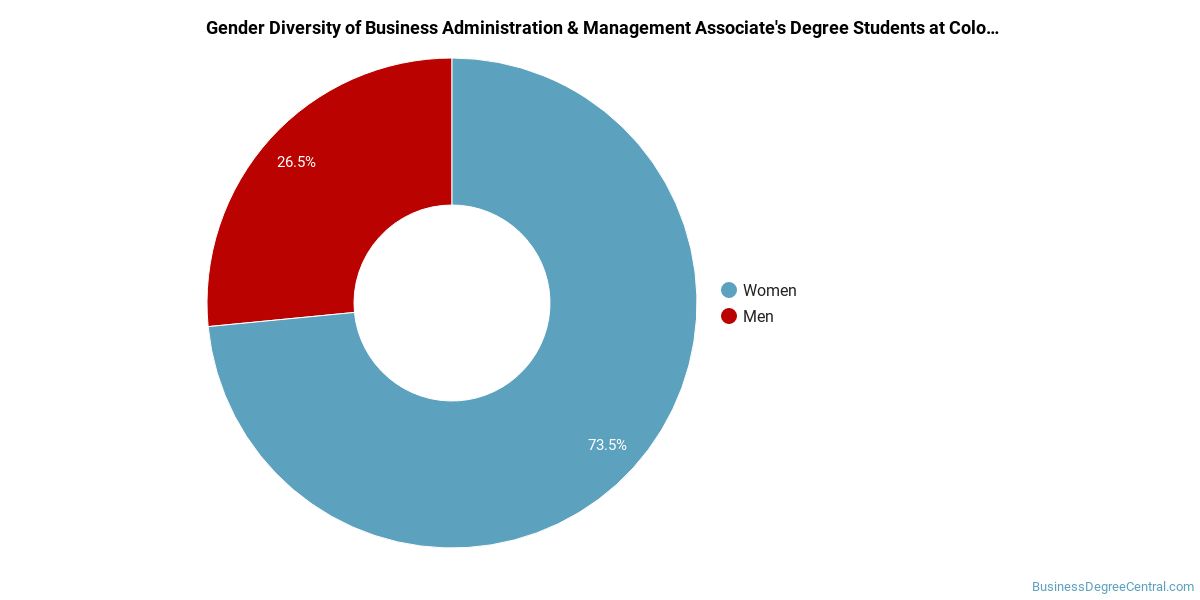
Business Administration & Management Associate’s Program at Colorado Technical University-Colorado Springs
Of the 1,849 associate’s business administration & management degrees awarded at Colorado Technical University-Colorado Springs, 75% were women (1,393) and 25% were men (456).
The following table and chart show the race/ethnicity of Business Administration & Management associate’s degree recipients at Colorado Technical University-Colorado Springs.
| Race / Ethnicity | Number of Graduates |
|---|---|
| White | 501 |
| Hispanic / Latino | 2 |
| Black / African American | 506 |
| Asian | 7 |
| American Indian / Alaska Native | 31 |
| Native Hawaiian / Pacific Islander | 11 |
| Two or More Races | 73 |
| Unknown | 718 |
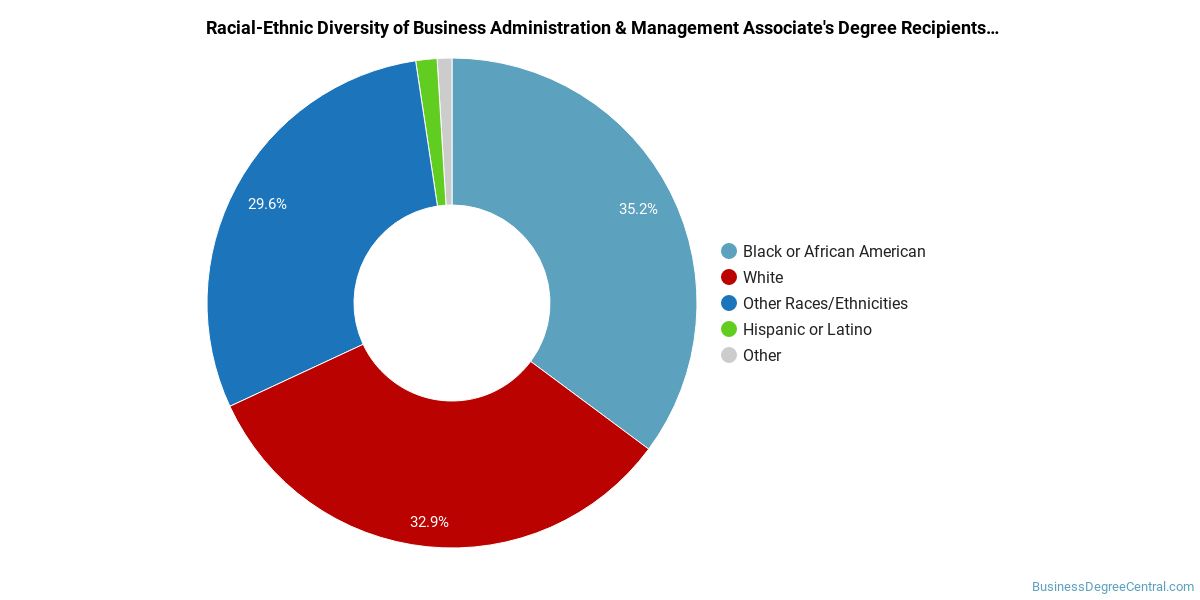
Minority students account for 34% of Business Administration & Management associate’s degree recipients at Colorado Technical University-Colorado Springs, lower than the national average of 51%.*
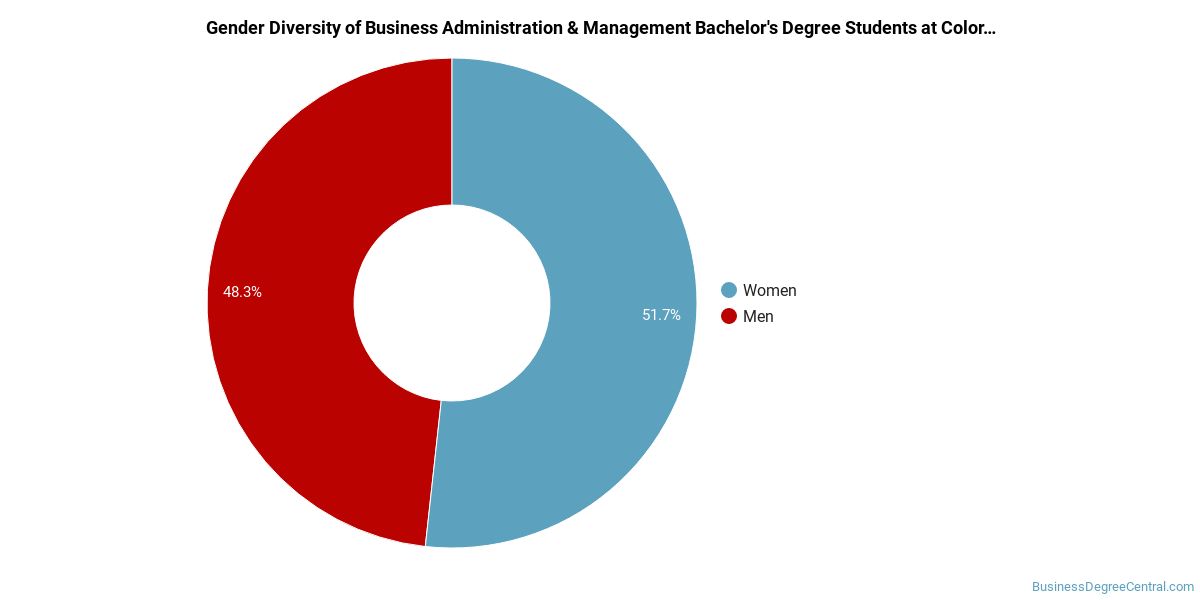
Business Administration & Management Bachelor’s Program at Colorado Technical University-Colorado Springs
Among the 1,621 bachelor’s business administration & management graduates at Colorado Technical University-Colorado Springs, 56% were women (901) and 44% were men (720).
The following table and chart show the race/ethnicity of Business Administration & Management bachelor’s degree recipients at Colorado Technical University-Colorado Springs.
| Race / Ethnicity | Number of Graduates |
|---|---|
| White | 521 |
| Hispanic / Latino | 7 |
| Black / African American | 338 |
| Asian | 19 |
| American Indian / Alaska Native | 20 |
| Native Hawaiian / Pacific Islander | 11 |
| Two or More Races | 58 |
| Unknown | 647 |
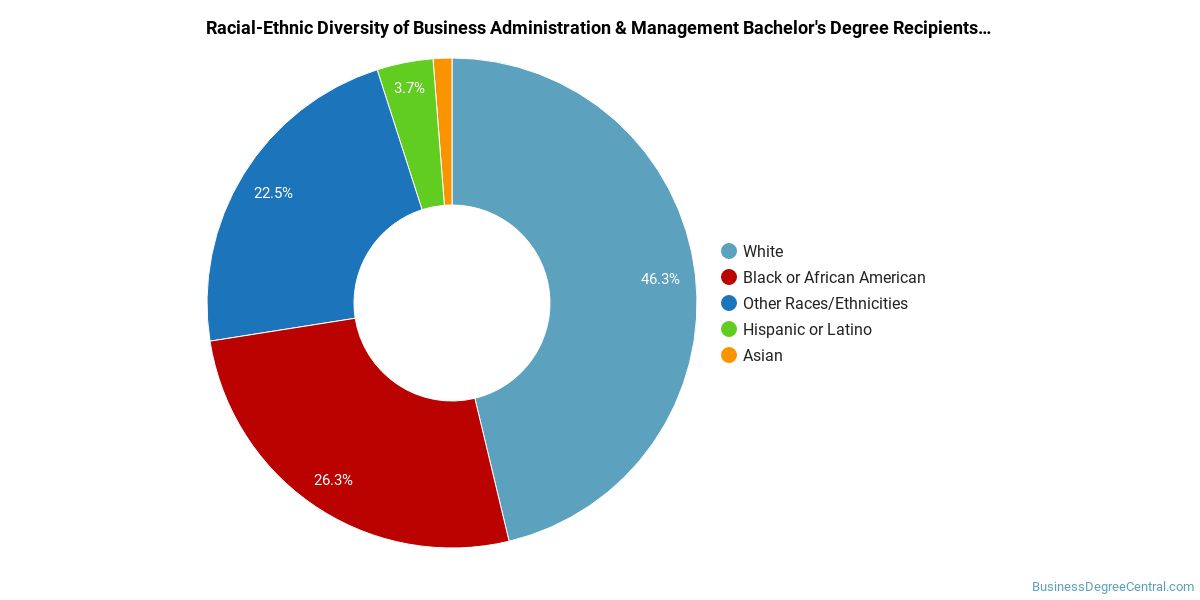
Racial-ethnic minorities make up 28% of Business Administration & Management bachelor’s degree recipients at Colorado Technical University-Colorado Springs, below the national average of 41%.*
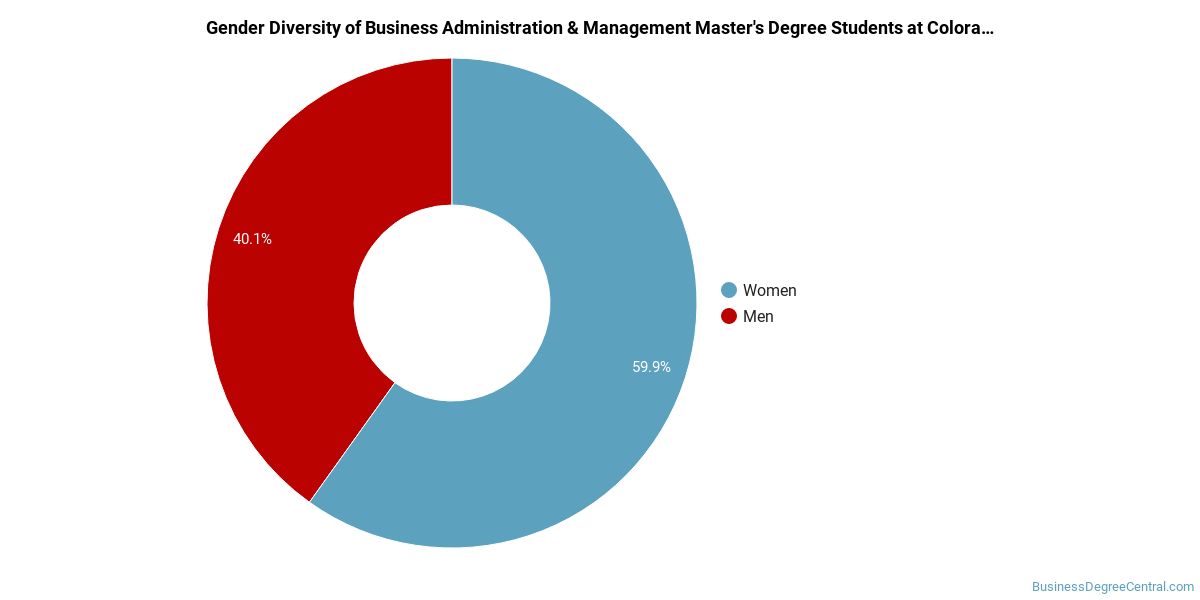
Business Administration & Management Master’s Program at Colorado Technical University-Colorado Springs
Among the 790 master’s business administration & management degrees awarded at Colorado Technical University-Colorado Springs, 74% were women (585) and 26% were men (205).
The following table and chart show the race/ethnicity of Business Administration & Management master’s degree recipients at Colorado Technical University-Colorado Springs.
| Race / Ethnicity | Number of Graduates |
|---|---|
| White | 224 |
| Hispanic / Latino | 4 |
| Black / African American | 160 |
| Asian | 24 |
| American Indian / Alaska Native | 10 |
| Native Hawaiian / Pacific Islander | 6 |
| Two or More Races | 34 |
| Unknown | 328 |
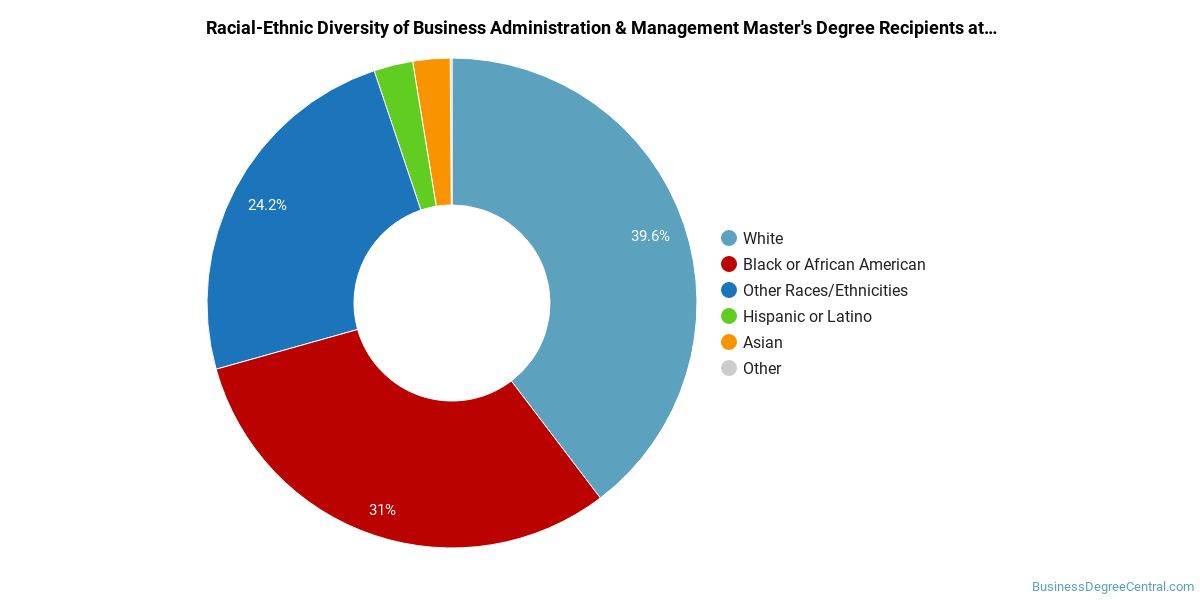
Racial-ethnic minorities make up 30% of Business Administration & Management master’s degree recipients at Colorado Technical University-Colorado Springs, below the national average of 36%.*
*The racial-ethnic minorities figure is the total number of graduates minus White, international (nonresident), and unknown-race graduates.
More Specific Business Administration & Management Concentrations at Colorado Technical University-Colorado Springs
This Business Administration & Management program at Colorado Technical University-Colorado Springs offers more specialized concentrations:
| Concentration | Graduates |
|---|---|
| Business Administration & Management | 4,226 |
| Project Management | 98 |
Best-Paid Careers for Business Administration & Management Graduates
Students who finish Business Administration & Management program at Colorado Technical University-Colorado Springs pursue many career paths. The table below ranks the best-paid careers for Business Administration & Management graduates, ordered by median annual salary:
| Occupation | Nationwide Median Wage |
|---|---|
| Loss Prevention Managers | $165,723 |
| Geothermal Production Managers | $160,381 |
| Administrative Services Managers | $158,084 |
| Facilities Managers | $157,669 |
| Biomass Power Plant Managers | $146,025 |
| Supply Chain Managers | $138,103 |
| Medical and Health Services Managers | $129,557 |
| Security Management Specialists | $128,654 |
| Industrial Production Managers | $126,666 |
| Wind Energy Operations Managers | $122,567 |
References
- IPEDS — Integrated Postsecondary Education Data System
- U.S. Department of Education — College Scorecard
- O*NET Online (Bureau of Labor Statistics)
- National Center for Education Statistics
More about our data sources and methodologies.
BusinessDegreeCentral.com provides higher-education, college and university, degree, program, career, salary, and other helpful information to students, faculty, institutions, and other internet audiences. Presented information and data are subject to change. Inclusion on this website does not imply or represent a direct relationship with the company, school, or brand. Information, though believed correct at time of publication, may not be correct, and no warranty is provided. Contact the schools to verify any information before relying on it. Financial aid may be available for those who qualify. The displayed options may include sponsored or recommended results, not necessarily based on your preferences.
© BusinessDegreeCentral.com – All Rights Reserved.