General and Operations Managers in Nevada
Want to work as a General and Operations Managers in Nevada? Here’s what you need to know. Plan, direct, or coordinate the operations of public or private sector organizations, overseeing multiple departments or locations. Duties and responsibilities include formulating policies, managing daily operations, and planning the use of materials and human resources, but are too diverse and general in nature to be classified in any one functional area of management or administration, such as personnel, purchasing, or administrative services. Usually manage through subordinate supervisors. Excludes First-Line Supervisors.
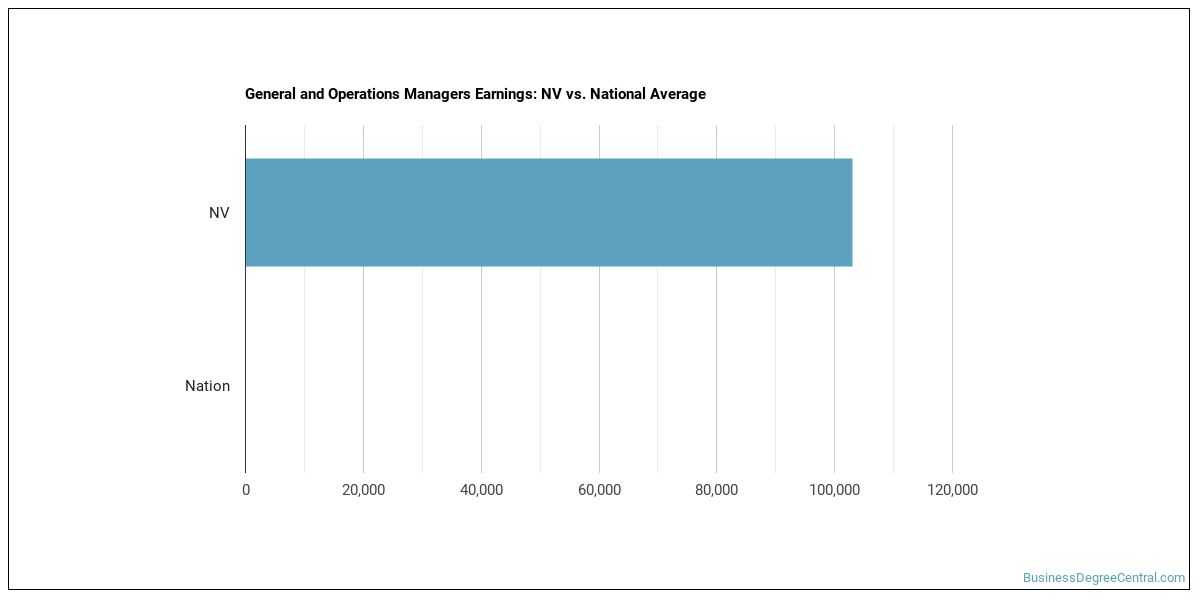
What do General and Operations Managers Make in Nevada?
The general and operations managers working in Nevada, wages run about $94,990 per year (or about $45.67/hour).Pay can range from $42,030 at the 10th percentile to $214,180 at the 90th percentile.
| Wage Statistic | Annual | Hourly |
|---|---|---|
| 10th percentile | $42,030 | $20.21 |
| 25th percentile | $60,560 | $29.11 |
| Median (50th) | $94,990 | $45.67 |
| 75th percentile | $143,070 | $68.79 |
| 90th percentile | $214,180 | $102.97 |

Location quotient — how concentrated this career is in Nevada relative to the national average — is 1.18, meaning that general and operations managers are more concentrated here than the national average.
National Wage Comparison
Nationally, general and operations managers earn a median of $149,694 per year ($71.97/hour), lower than the Nevada median.
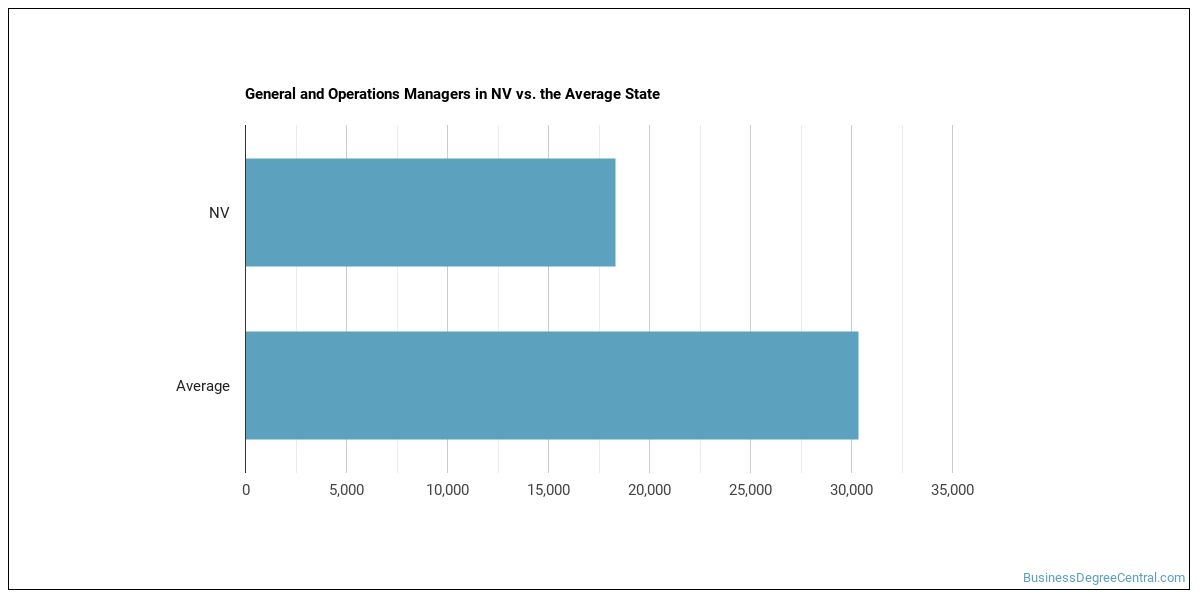
Employment Outlook
Nationally, total employment in this occupation is 167,026 general and operations managers in the U.S.. In Nevada alone, approximately 42,130 people work in this role. That matches the typical state median of 42,130.

Top Nevada Metros for General and Operations Managers
These are the Nevada metros with the most general and operations managers in Nevada.
| Metro Area | Number Employed | Annual Median Salary |
|---|---|---|
| Las Vegas-Henderson-North Las Vegas, NV | 30,280 | $92,100 |
| Reno, NV | 8,150 | $102,320 |
| Carson City, NV | 870 | $98,940 |
Top States for General and Operations Managers Employment
These states have the highest employment of general and operations managers work.
| State | Number Employed |
|---|---|
| Texas | 454,720 |
| California | 292,300 |
| Florida | 249,620 |
| New York | 210,890 |
| Illinois | 170,790 |
| Pennsylvania | 168,110 |
| Ohio | 146,860 |
| Georgia | 111,240 |
| Massachusetts | 105,350 |
| Missouri | 105,210 |
| Arizona | 100,340 |
| Virginia | 99,710 |
| Maryland | 91,810 |
| Michigan | 86,000 |
| Minnesota | 73,900 |
| North Carolina | 72,250 |
| Tennessee | 66,610 |
| New Jersey | 63,940 |
| Kentucky | 58,570 |
| Washington | 53,800 |
Highest-Paying States for General and Operations Managers
Where general and operations managers earn the most: general and operations managers.
| State | Annual Median Salary |
|---|---|
| District of Columbia | $167,270 |
| New Jersey | $149,990 |
| Delaware | $136,900 |
| South Dakota | $133,440 |
| Colorado | $130,340 |
| Washington | $130,240 |
| Connecticut | $130,230 |
| New York | $129,990 |
| California | $125,240 |
| Massachusetts | $123,850 |
Skills
Top general and operations managers skills, rated on an importance scale of 0 to 5:
Knowledge Areas
Key knowledge areas for this occupation, rated on an importance scale of 0 to 5:
Abilities
Key abilities for general and operations managers, rated on an importance scale of 0 to 5:
Daily Tasks
Common tasks include:
- Review financial statements, sales or activity reports, or other performance data to measure productivity or goal achievement or to identify areas needing cost reduction or program improvement.
- Direct and coordinate activities of businesses or departments concerned with the production, pricing, sales, or distribution of products.
- Direct administrative activities directly related to making products or providing services.
- Prepare staff work schedules and assign specific duties.
- Direct or coordinate financial or budget activities to fund operations, maximize investments, or increase efficiency.
- Plan or direct activities, such as sales promotions, that require coordination with other department managers.
- Perform personnel functions, such as selection, training, or evaluation.
- Establish or implement departmental policies, goals, objectives, or procedures in conjunction with board members, organization officials, or staff members.
- Monitor suppliers to ensure that they efficiently and effectively provide needed goods or services within budgetary limits.
- Manage the movement of goods into and out of production facilities to ensure efficiency, effectiveness, or sustainability of operations.
- Set prices or credit terms for goods or services, based on forecasts of customer demand.
- Perform sales floor work, such as greeting or assisting customers, stocking shelves, or taking inventory.
Work Activities
- Working with Computers
- Getting Information
- Communicating with Supervisors, Peers, or Subordinates
- Making Decisions and Solving Problems
- Establishing and Maintaining Interpersonal Relationships
- Identifying Objects, Actions, and Events
- Organizing, Planning, and Prioritizing Work
- Guiding, Directing, and Motivating Subordinates
- Judging the Qualities of Objects, Services, or People
- Processing Information
- Analyzing Data or Information
- Coordinating the Work and Activities of Others
Tools & Technology
Technologies frequently used: Hot technologies: Adobe Acrobat, Adobe Creative Cloud software, Adobe Photoshop, Amazon Web Services AWS software, Apache Hadoop, Apple macOS, Atlassian Confluence In-demand technologies: Microsoft Excel
What Major Will Prepare You For This Career?
Related college programs include:
- Business Administration & Management
- Business & Commerce
- Finance & Financial Management
- Management Sciences & Methods
- Entrepreneurial Studies
- International Business
Featured schools near , edit
Related Careers
Careers similar to general and operations managers include:
- Facilities Managers
- Industrial Production Managers
- Transportation, Storage, and Distribution Managers
- Construction Managers
- Project Management Specialists
- Management Analysts
Also Known As
Area Manager, Boards and Commissions Director, Business Coordinator, Business Manager, Center Manager, Chief Administrative Officer (CAO), Corporate Manager, Department Manager, Department Store General Manager (Dept Store GM), Department Store Manager (Dept Store Manager), District Commercial Superintendent, District Manager, District Plant Superintendent, District Traffic Chief, District Wire Chief.
References
- U.S. Bureau of Labor Statistics, Occupational Employment and Wage Statistics — https://www.bls.gov/oes/
- O*NET Online — https://www.onetonline.org/
- BLS Employment Projections — https://www.bls.gov/emp/
- O*NET-SOC code: 11-1021.00
BusinessDegreeCentral.com provides higher-education, college and university, degree, program, career, salary, and other helpful information to students, faculty, institutions, and other internet audiences. Presented information and data are subject to change. Inclusion on this website does not imply or represent a direct relationship with the company, school, or brand. Information, though believed correct at time of publication, may not be correct, and no warranty is provided. Contact the schools to verify any information before relying on it. Financial aid may be available for those who qualify. The displayed options may include sponsored or recommended results, not necessarily based on your preferences.
© BusinessDegreeCentral.com – All Rights Reserved.