Financial and Investment Analysts in Hawaii
Thinking about a career as a Financial and Investment Analysts in Hawaii? Here’s what the data says. Conduct quantitative analyses of information involving investment programs or financial data of public or private institutions, including valuation of businesses. Excludes “Budget Analysts” (13-2031), “Financial Risk Specialists” (13-2054), and “Securities, Commodities, and Financial Services Sales Agents” (41-3031).
What do Financial and Investment Analysts Make in Hawaii?
For financial and investment analysts working in Hawaii, the median annual wage is $86,100 per year (or about $41.39/hour).Annual wages span from $62,250 at the 10th percentile to $121,290 at the 90th percentile.
| Wage Statistic | Annual | Hourly |
|---|---|---|
| 10th percentile | $62,250 | $29.93 |
| 25th percentile | $69,680 | $33.50 |
| Median (50th) | $86,100 | $41.39 |
| 75th percentile | $101,560 | $48.83 |
| 90th percentile | $121,290 | $58.31 |

Location quotient — how concentrated this career is in Hawaii relative to the national average — is 0.36, indicating fewer financial and investment analysts per worker than the national average.
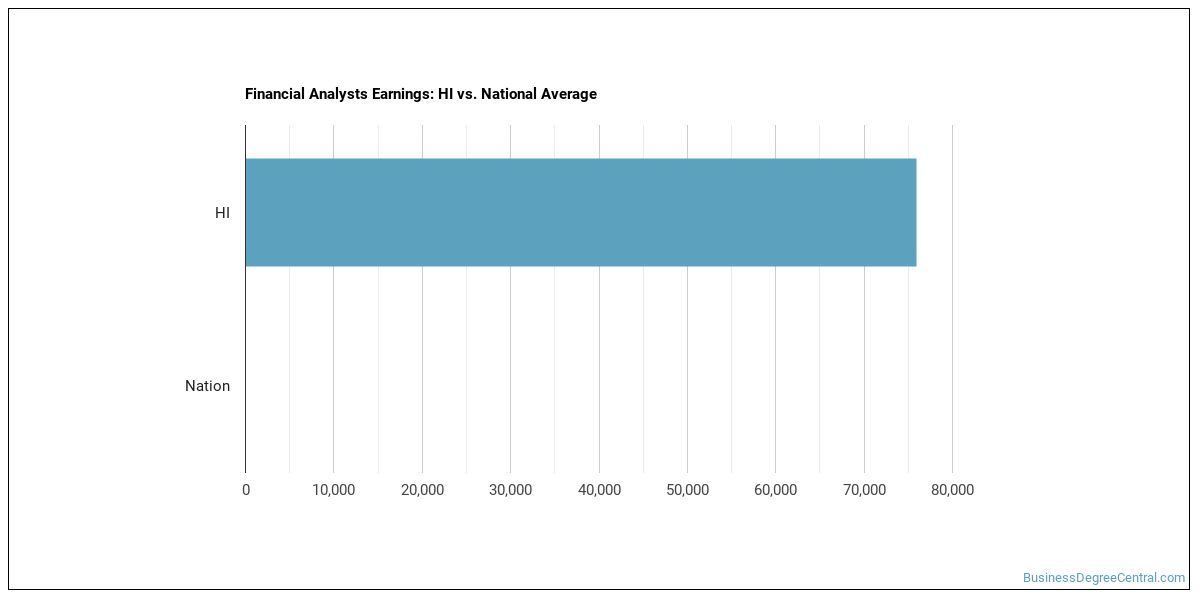
National Wage Comparison
Nationally, financial and investment analysts earn a median of $82,666 per year ($39.74/hour), exceeding the Hawaii median.
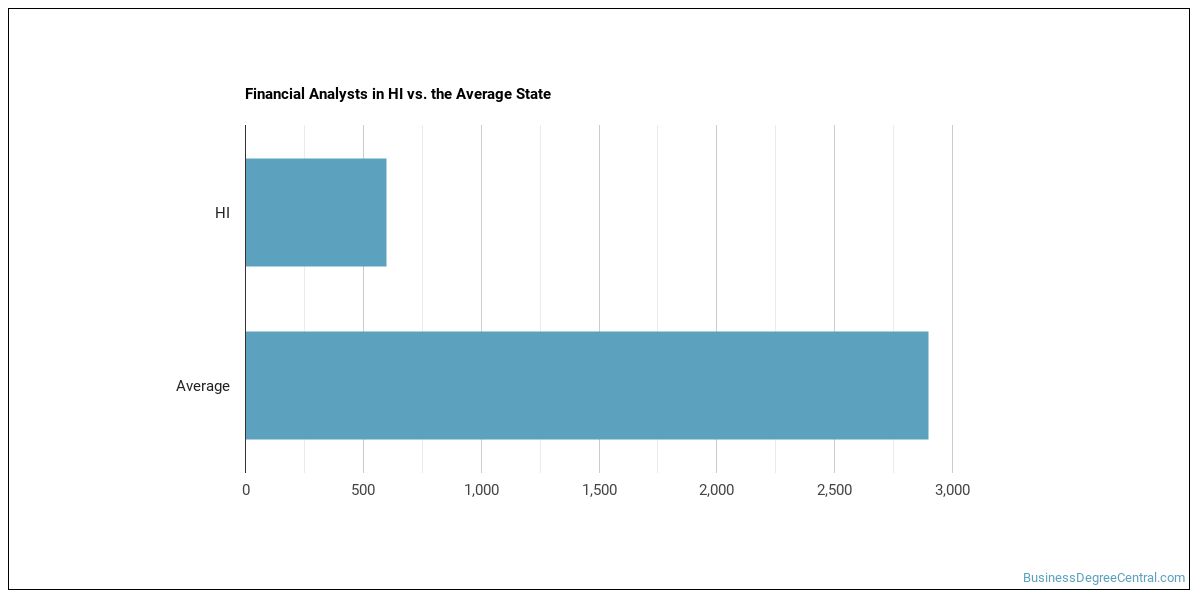
Employment Outlook
Nationally, total employment in this occupation is 72,056 financial and investment analysts in the U.S.. In Hawaii alone, about 490 people work in this role. That trails the typical state, which employs around 3,140 financial and investment analysts.

Top Hawaii Metros for Financial and Investment Analysts
The metro areas below employ the most financial and investment analysts in Hawaii.
| Metro Area | Number Employed | Annual Median Salary |
|---|---|---|
| Urban Honolulu, HI | 450 | $84,840 |
Top States for Financial and Investment Analysts Employment
These states have the highest employment of financial and investment analysts work.
| State | Number Employed |
|---|---|
| New York | 47,130 |
| California | 40,570 |
| Texas | 26,940 |
| Florida | 21,690 |
| Massachusetts | 18,020 |
| Illinois | 17,950 |
| Pennsylvania | 12,220 |
| New Jersey | 11,100 |
| Georgia | 10,330 |
| North Carolina | 10,330 |
| Ohio | 9,290 |
| Colorado | 9,120 |
| Virginia | 8,870 |
| Michigan | 8,020 |
| Washington | 7,780 |
| Minnesota | 6,690 |
| Maryland | 6,190 |
| Wisconsin | 4,960 |
| Arizona | 4,910 |
| Connecticut | 4,870 |
Highest-Paying States for Financial and Investment Analysts
The highest-paying states for financial and investment analysts.
| State | Annual Median Salary |
|---|---|
| Wyoming | $213,940 |
| New York | $126,580 |
| California | $111,100 |
| New Jersey | $109,380 |
| Oregon | $107,680 |
| Massachusetts | $107,610 |
| District of Columbia | $106,840 |
| Connecticut | $106,250 |
| Virginia | $104,030 |
| Minnesota | $102,800 |
Daily Tasks
Day-to-day, financial and investment analysts typically:
- Advise clients on aspects of capitalization, such as amounts, sources, or timing.
- Analyze financial or operational performance of companies facing financial difficulties to identify or recommend remedies.
- Assess companies as investments for clients by examining company facilities.
- Collaborate on projects with other professionals, such as lawyers, accountants, or public relations experts.
- Collaborate with investment bankers to attract new corporate clients.
- Conduct financial analyses related to investments in green construction or green retrofitting projects.
- Confer with clients to restructure debt, refinance debt, or raise new debt.
- Create client presentations of plan details.
- Determine the prices at which securities should be syndicated and offered to the public.
- Develop and maintain client relationships.
- Draw charts and graphs, using computer spreadsheets, to illustrate technical reports.
- Employ financial models to develop solutions to financial problems or to assess the financial or capital impact of transactions.
Tools & Technology
Technologies frequently used: Hot technologies: Alteryx software, Apache Hive, Google Docs, IBM SPSS Statistics, Intuit QuickBooks In-demand technologies: Microsoft Excel
What Major Will Prepare You For This Career?
Programs that train for this career include:
- Finance & Financial Management
- Accounting
Featured schools near , edit
Related Careers
Related occupations to financial and investment analysts include:
- Financial Managers
- Investment Fund Managers
- Management Analysts
- Market Research Analysts and Marketing Specialists
- Accountants and Auditors
- Credit Analysts
Also Known As
Accounting Analyst, Acquisition Analyst, Acquisition Specialist, Acquisitions Analyst, Acquisitions Consultant, Alternative Financing Specialist, Analyst, Bank Analyst, Banking Analyst, Bond Analyst, Brand Analyst, Chartered Financial Analyst (CFA), Commodity Analyst, Corporate Financial Analyst, Corporate Securities Research Analyst.
References
- U.S. Bureau of Labor Statistics, Occupational Employment and Wage Statistics — https://www.bls.gov/oes/
- O*NET Online — https://www.onetonline.org/
- BLS Employment Projections — https://www.bls.gov/emp/
- O*NET-SOC code: 13-2051.00
BusinessDegreeCentral.com provides higher-education, college and university, degree, program, career, salary, and other helpful information to students, faculty, institutions, and other internet audiences. Presented information and data are subject to change. Inclusion on this website does not imply or represent a direct relationship with the company, school, or brand. Information, though believed correct at time of publication, may not be correct, and no warranty is provided. Contact the schools to verify any information before relying on it. Financial aid may be available for those who qualify. The displayed options may include sponsored or recommended results, not necessarily based on your preferences.
© BusinessDegreeCentral.com – All Rights Reserved.