Lehigh University Business Programs
Lehigh University is a private not-for-profit institution located in Bethlehem, PA. A Smaller City provides a peaceful environment near the excitement of urban amenities.
Featured schools near , edit
Lehigh University Rankings
Lehigh University has earned the following rankings for business programs at the bachelors level:
| Ranking | Rank | Among |
|---|---|---|
| Overall Quality | #5 of 262 | State — Pennsylvania |
| Overall Quality | #14 of 758 | Region — Middle Atlantic |
| Overall Quality | #60 of 4,630 | Nationwide |
Where Is Lehigh University?
Get in touch with Lehigh University can be found below.
| Contact Details | |
|---|---|
| Address: | 27 Memorial Drive West, Bethlehem, PA 18015 |
| Phone: | 6107583000 |
| Website: | www.lehigh.edu/ |
| Admissions: | www.lehigh.edu/admissions |
| Financial Aid: | www.lehigh.edu/financialaid |
How Do I Get Into Lehigh University?
You can apply to Lehigh University online at: www1.lehigh.edu/admissions/undergrad/apply
Lehigh University is classified as Very Selective (20-30%) for admissions.
Admission Requirements for Lehigh University
This is what Lehigh University looks for in applicants:
| Requirement | Status |
|---|---|
| Secondary School Record | Required |
| Secondary School GPA | Required |
| Recommendations | Required |
| Admission Test Scores (SAT/ACT) | Considered but not required |
How Hard Is It To Get Into Lehigh University?
Lehigh University has an acceptance rate of 26%, making it moderately selective. Be sure to prepare a complete application and prepare the application in full.
Of those admitted, 28% choose to enroll — a typical enrollment-to-admission yield.
Average Test Scores
30% of admitted students submitted SAT scores and 9% submitted ACT scores.
When looking at the 25th through the 75th percentile of admitted students at Lehigh University, SAT Evidence-Based Reading and Writing scores ranged between 680 and 730. Math scores were between 690 and 770.
Selectivity by Gender
Selectivity numbers at Lehigh University are broken out by gender below.
| Gender | Applicants | Admitted | Acceptance Rate |
|---|---|---|---|
| Men | 10,556 | 2,551 | 24% |
| Women | 9,834 | 2,736 | 28% |
Can I Afford Lehigh University?
The average net price after aid at Lehigh University is $33,549. Cost varies significantly based on your financial situation since net price varies by income group.
Tuition & Fees
| Category | Cost |
|---|---|
| In-State Tuition | $63,930 |
| In-State Fees | $1,050 |
| Out-of-State Tuition | $63,930 |
| Out-of-State Fees | $1,050 |
| Total In-State Tuition & Fees | $64,980 |
| Total Out-of-State Tuition & Fees | $64,980 |
Financial Aid
When including loans, work-study, and grants, 26% of students at Lehigh University receive some form of financial aid (1,531 students).
About 57% of students at Lehigh University receive grant or scholarship aid, averaging $47,917 per student.
18% of students receive federal Pell Grants, averaging $5,930.
Student Loan Debt
37% of Lehigh University undergraduates take out federal student loans, averaging $5,915 per year.
Lehigh University Undergraduate Student Diversity
There are 1,988 students enrolled at Lehigh University. Lehigh University is classified as a 5,000 - 9,999 institution by enrollment size. Its Carnegie Classification is Doctoral Universities: Higher Research Activity.
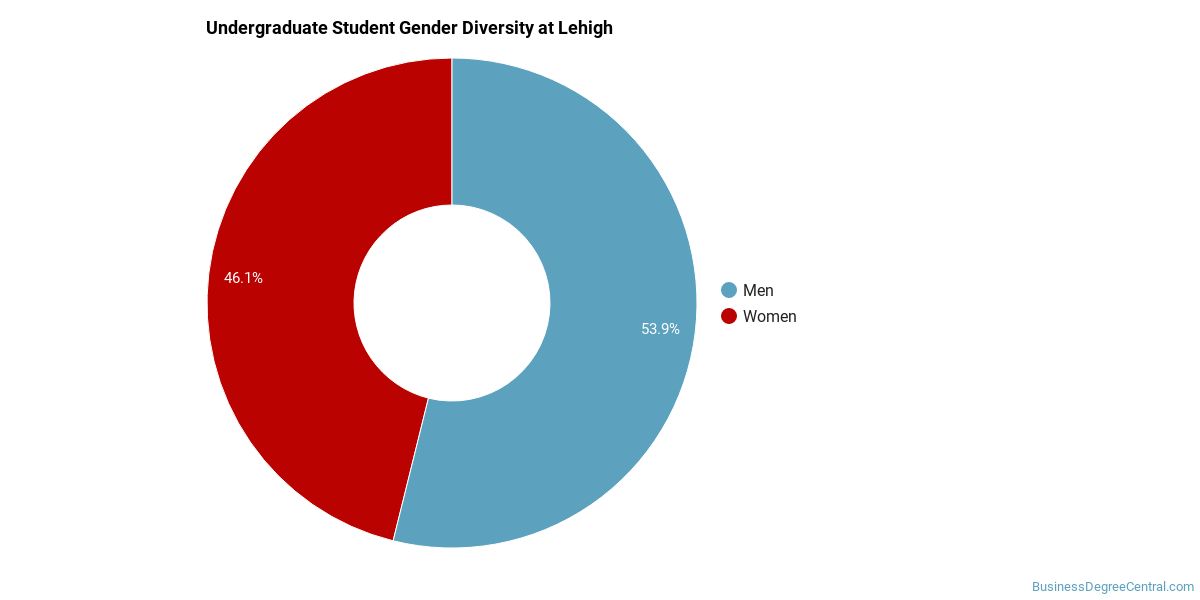
Gender Diversity
Of the 5,803 undergraduate students at Lehigh University, approximately 52% are male and 48% are female.
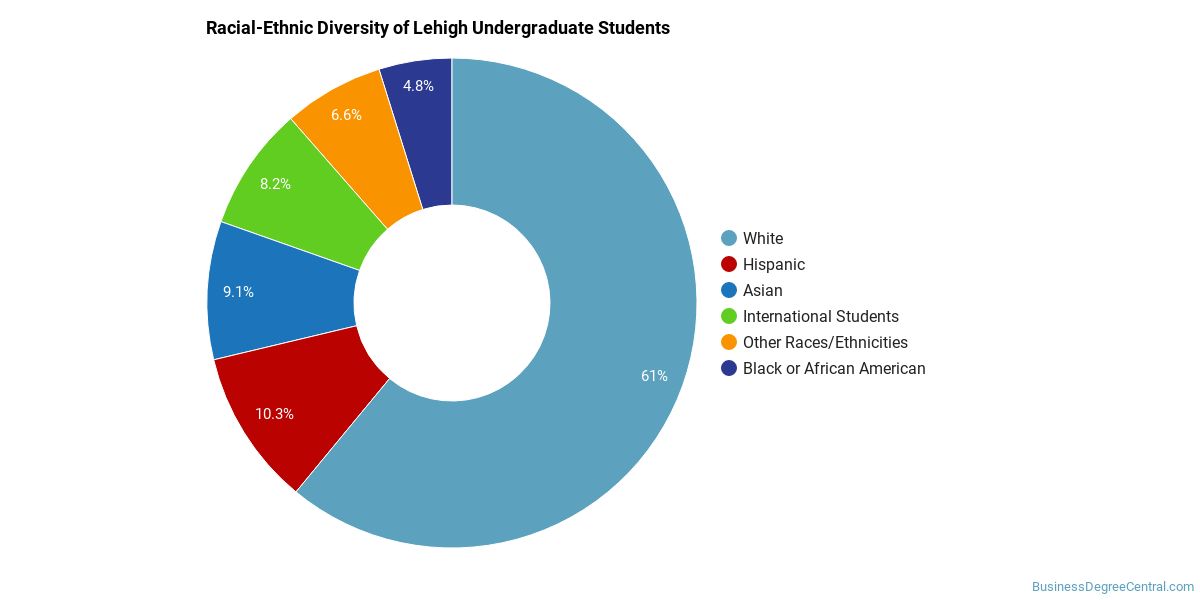
Racial-Ethnic Diversity
The racial-ethnic breakdown of Lehigh University undergraduate students is as follows.
| Race/Ethnicity | Number of Students |
|---|---|
| Asian | 620 |
| Black or African American | 290 |
| Hispanic | 638 |
| White | 3,458 |
| American Indian/Alaska Native | 5 |
| Native Hawaiian/Pacific Islander | 5 |
| Two or More Races | 255 |
| Non-Resident | 388 |
Geographic Diversity
The top 5 home states of first-time undergraduate students at Lehigh University are shown below.

| State | First-Time UG Students |
|---|---|
| Pennsylvania | 372 |
| New Jersey | 282 |
| New York | 238 |
| Connecticut | 89 |
| Massachusetts | 79 |
Additionally, approximately 6.7% of undergraduate students are non-resident from outside the United States.
Lehigh University Graduate Student Diversity
1,779 of Lehigh University’s students are in graduate programs. The highest graduate-level award offered is Doctor’s degree.
Gender Diversity (Graduate)
Among graduate students at Lehigh University, approximately 51% are male and 49% are female.

Racial-Ethnic Diversity (Graduate)
The racial-ethnic breakdown of Lehigh University graduate students is as follows.

| Race/Ethnicity | Number of Students |
|---|---|
| Asian | 85 |
| Black or African American | 53 |
| Hispanic | 113 |
| White | 868 |
| Two or More Races | 14 |
| Non-Resident | 599 |
Online Learning at Lehigh University
Lehigh University offers distance learning options for students who need flexibility.
72 undergraduate students at Lehigh University took at least one online class.
At the graduate level, 218 students took at least one online class and 377 took all classes online. Distance education is available at the undergraduate and graduate levels.
Business Programs at Lehigh University
These business degree programs are offered by Lehigh University, with the number of degrees awarded at each level in the most recent reporting year.
| Program | Bachelor’s | Master’s | Doctorate | Total |
|---|---|---|---|---|
| Finance and Financial Management Services | 218 | 3 | — | 221 |
| Business Administration, Management and Operations | 34 | 65 | — | 99 |
| Accounting and Related Services | 56 | — | — | 56 |
| Business/Commerce, General | 37 | 17 | — | 54 |
| Marketing | 52 | 2 | — | 54 |
| Business/Managerial Economics | 48 | — | — | 48 |
| Management Sciences and Quantitative Methods | — | 5 | — | 6 |
| Entrepreneurial and Small Business Operations | — | 5 | — | 5 |
| International Business | — | — | — | 2 |
Academic Programs at Lehigh University
Lehigh University offers 23 distinct academic programs.
The highest level of award offered is Doctor’s degree.
Institutional Profile
Lehigh University has an open admission policy: No. Credit transfer:
- AP credits: Implied no
- Dual enrollment credits: Yes
- Life experience credits: Implied no
References
More about our data sources and methodologies.
Featured Schools

You have goals. Southern New Hampshire University can help you get there. Whether you need a bachelor's degree to get into a career or want a master's degree to move up in your current career, SNHU has an online program for you. Find your degree from over 200 online programs.
Visit SchoolBusinessDegreeCentral.com provides higher-education, college and university, degree, program, career, salary, and other helpful information to students, faculty, institutions, and other internet audiences. Presented information and data are subject to change. Inclusion on this website does not imply or represent a direct relationship with the company, school, or brand. Information, though believed correct at time of publication, may not be correct, and no warranty is provided. Contact the schools to verify any information before relying on it. Financial aid may be available for those who qualify. The displayed options may include sponsored or recommended results, not necessarily based on your preferences.
© BusinessDegreeCentral.com – All Rights Reserved.