Managers, All Other: Job Description
All managers not listed separately.
Featured schools near , edit
What Tasks Do Managers, All Other Take On?
Related Job Titles
People in this occupation may also be known by titles such as:
- Animal Ride Manager
- Aquatic Facility Manager
- Area Development Manager
- Area Supervisor
- Armored Transport Service Manager
- Art Coordinator
- Arts Administrator
- Association Executive
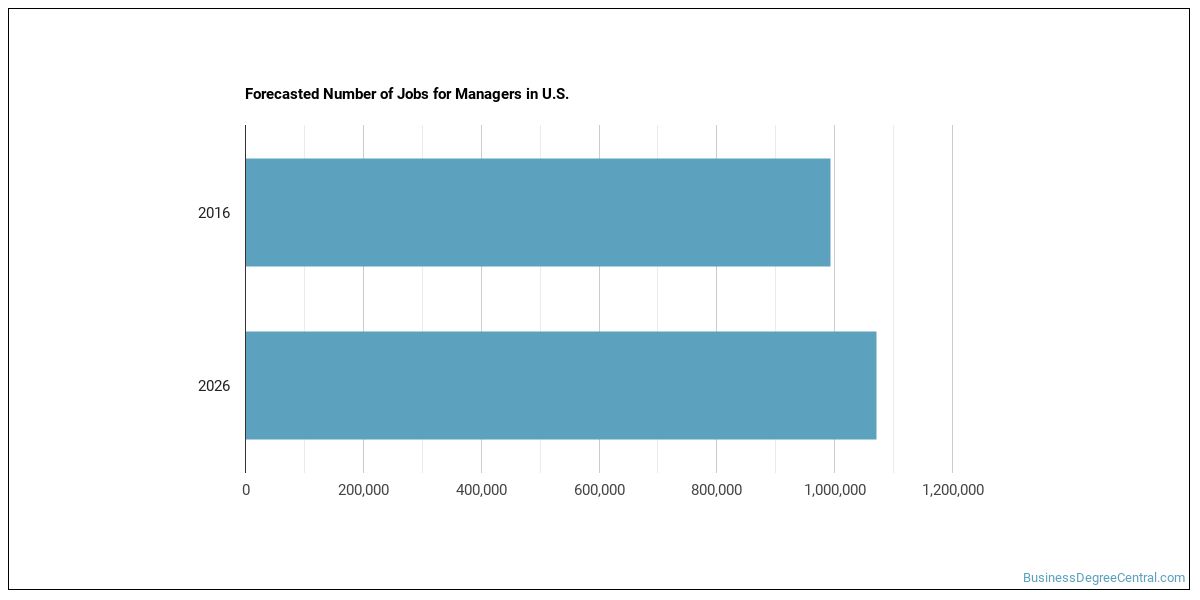
Job Outlook
There are roughly 440,588 managers, all other working in the United States today. This occupation is expected to grow by +6.2% over the projection horizon.
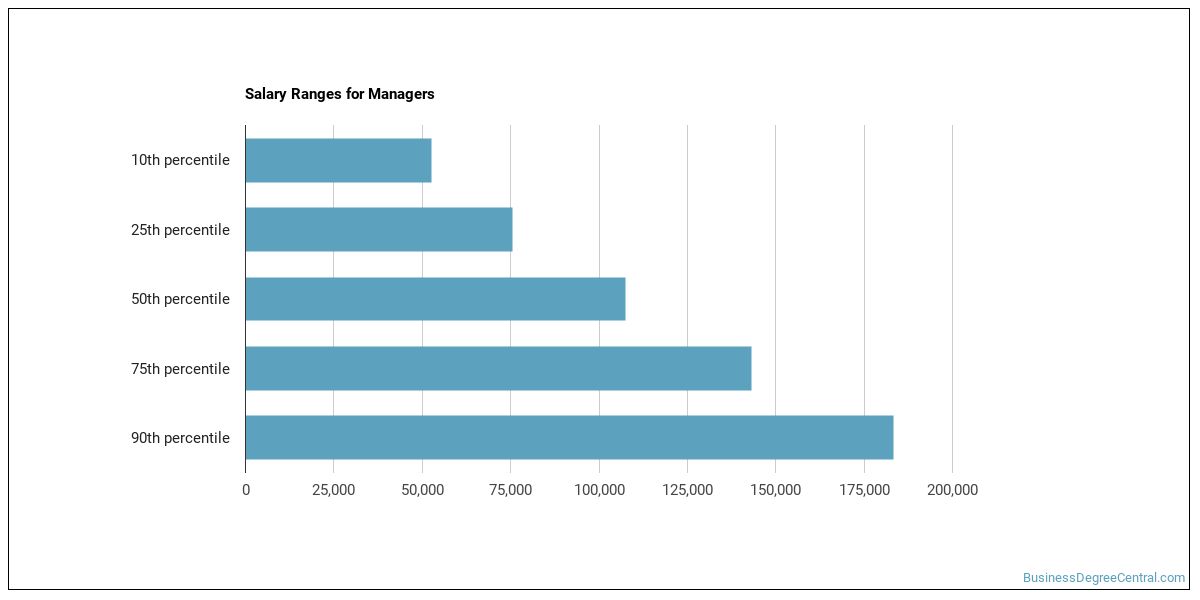
Salary for Managers, All Other
| Statistic | Value |
|---|---|
| Annual median | $95,684 |
| Hourly median | $46.00 |
| 10th percentile | $58,810 |
| 25th percentile | $77,247 |
| 75th percentile | $114,122 |
| 90th percentile | $132,559 |
Wages vary widely based on experience, location, and industry.
Managers, All Other Salary by State
| State | Annual median salary |
|---|---|
| Massachusetts | $172,380 |
| District of Columbia | $171,910 |
| California | $170,740 |
| Delaware | $170,310 |
| Washington | $165,080 |
| Colorado | $164,010 |
| New Jersey | $163,630 |
| Virginia | $162,610 |
| New York | $161,360 |
| Minnesota | $158,680 |
| Connecticut | $149,690 |
| Maryland | $148,680 |
| Rhode Island | $147,240 |
| New Hampshire | $142,650 |
| Illinois | $134,810 |
| Texas | $133,070 |
| Michigan | $133,040 |
| Arizona | $132,040 |
| North Carolina | $131,990 |
| Pennsylvania | $129,170 |
| Iowa | $127,680 |
| New Mexico | $127,060 |
| Ohio | $126,600 |
| West Virginia | $126,250 |
| Oklahoma | $124,800 |
| Oregon | $124,190 |
| Maine | $123,950 |
| Vermont | $123,930 |
| Alaska | $123,160 |
| Kentucky | $123,010 |
| Hawaii | $122,520 |
| Georgia | $120,810 |
| South Carolina | $120,640 |
| Kansas | $118,310 |
| North Dakota | $118,010 |
| Wyoming | $117,060 |
| Missouri | $117,050 |
| Alabama | $116,830 |
| Nebraska | $114,050 |
| South Dakota | $111,630 |
| Idaho | $107,800 |
| Montana | $105,840 |
| Wisconsin | $105,690 |
| Florida | $102,670 |
| Louisiana | $100,890 |
| Nevada | $99,590 |
| Mississippi | $97,780 |
| Guam | $97,210 |
| Virgin Islands | $92,270 |
| Tennessee | $88,110 |
| Arkansas | $84,610 |
| Indiana | $79,080 |
| Puerto Rico | $78,740 |
Pay by U.S. Region
Earnings for managers, all other shift depending on where you work. These regions lead on median pay:
| Region | Median annual wage | Share of U.S. jobs | Location quotient |
|---|---|---|---|
| Far Western US | $160,982 | 22.6% | 1.34 |
| New England | $156,233 | 3.9% | 0.83 |
| Middle Atlantic | $153,807 | 17.6% | 2.07 |
| Southwest | $132,453 | 11.2% | 0.90 |
| Plains States | $126,095 | 4.1% | 0.64 |
| Southeast | $116,490 | 29.4% | 1.35 |
| Rocky Mountains | $112,945 | 3.8% | 1.01 |
| Great Lakes | $112,898 | 6.4% | 0.72 |
Highest-Paying Metro Areas for Managers, All Other
| Metro area | State | Median annual wage | Employment |
|---|---|---|---|
| San Jose-Sunnyvale-Santa Clara, CA | CA | $215,120 | 13,530 |
| San Francisco-Oakland-Fremont, CA | CA | $203,030 | 22,980 |
| Lewiston-Auburn, ME | ME | $190,070 | 100 |
| Kennewick-Richland, WA | WA | $175,070 | 400 |
| Boston-Cambridge-Newton, MA-NH | MA | $174,840 | 9,240 |
| Boulder, CO | CO | $173,490 | 1,080 |
| Binghamton, NY | NY | $171,190 | 190 |
| Seattle-Tacoma-Bellevue, WA | WA | $168,750 | 7,580 |
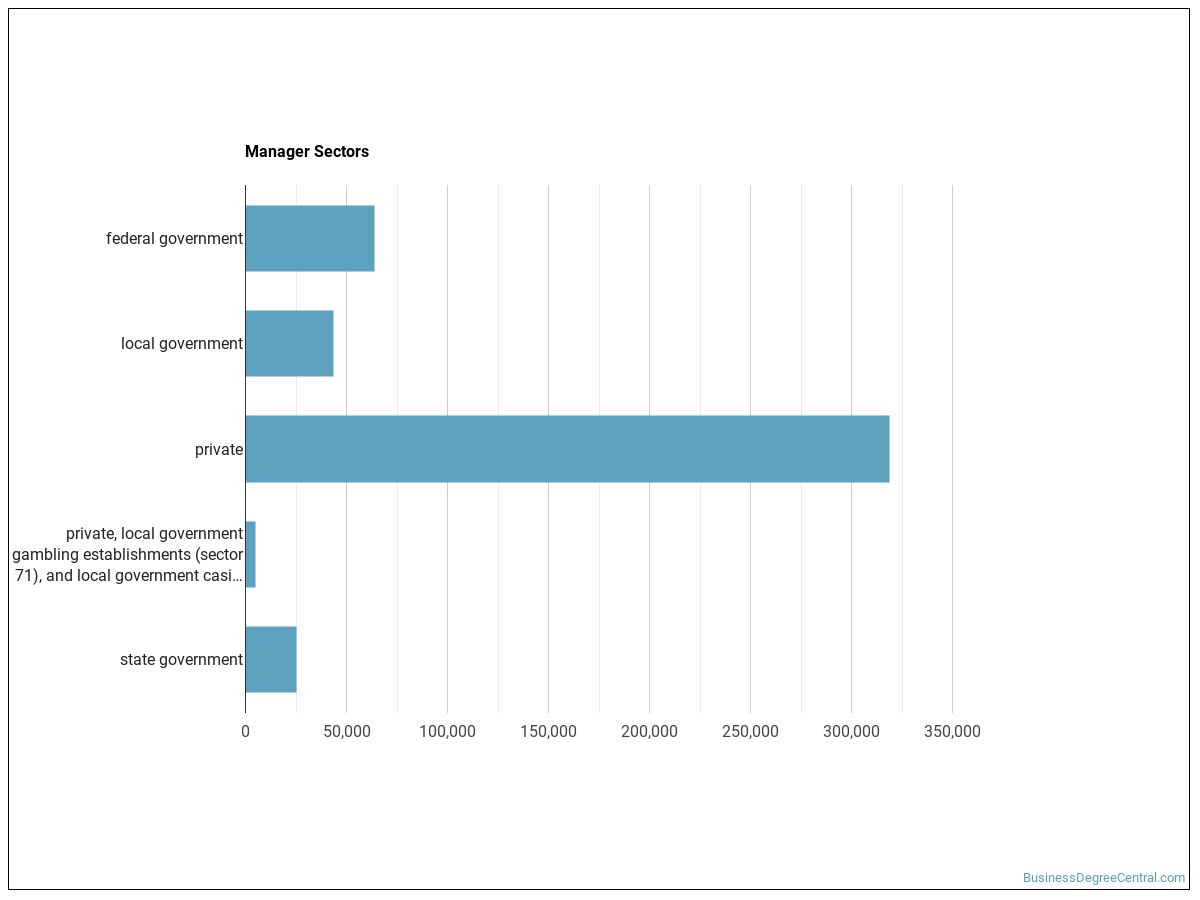
Industry Breakdown
Most managers, all other are concentrated in the following sectors:
| Industry | Employment | Median annual wage |
|---|---|---|
| Professional, Scientific, and Technical Services | 94,490 | $164,060 |
| Management of Companies and Enterprises | 50,980 | $163,830 |
| Manufacturing | 46,390 | $160,640 |
| Finance and Insurance | 44,890 | $162,780 |
| Information | 38,680 | $167,740 |
| Educational Services | 32,840 | $102,450 |
| Administrative and Support and Waste Management and Remediation Services | 32,500 | $109,990 |
| Health Care and Social Assistance | 31,360 | $108,810 |
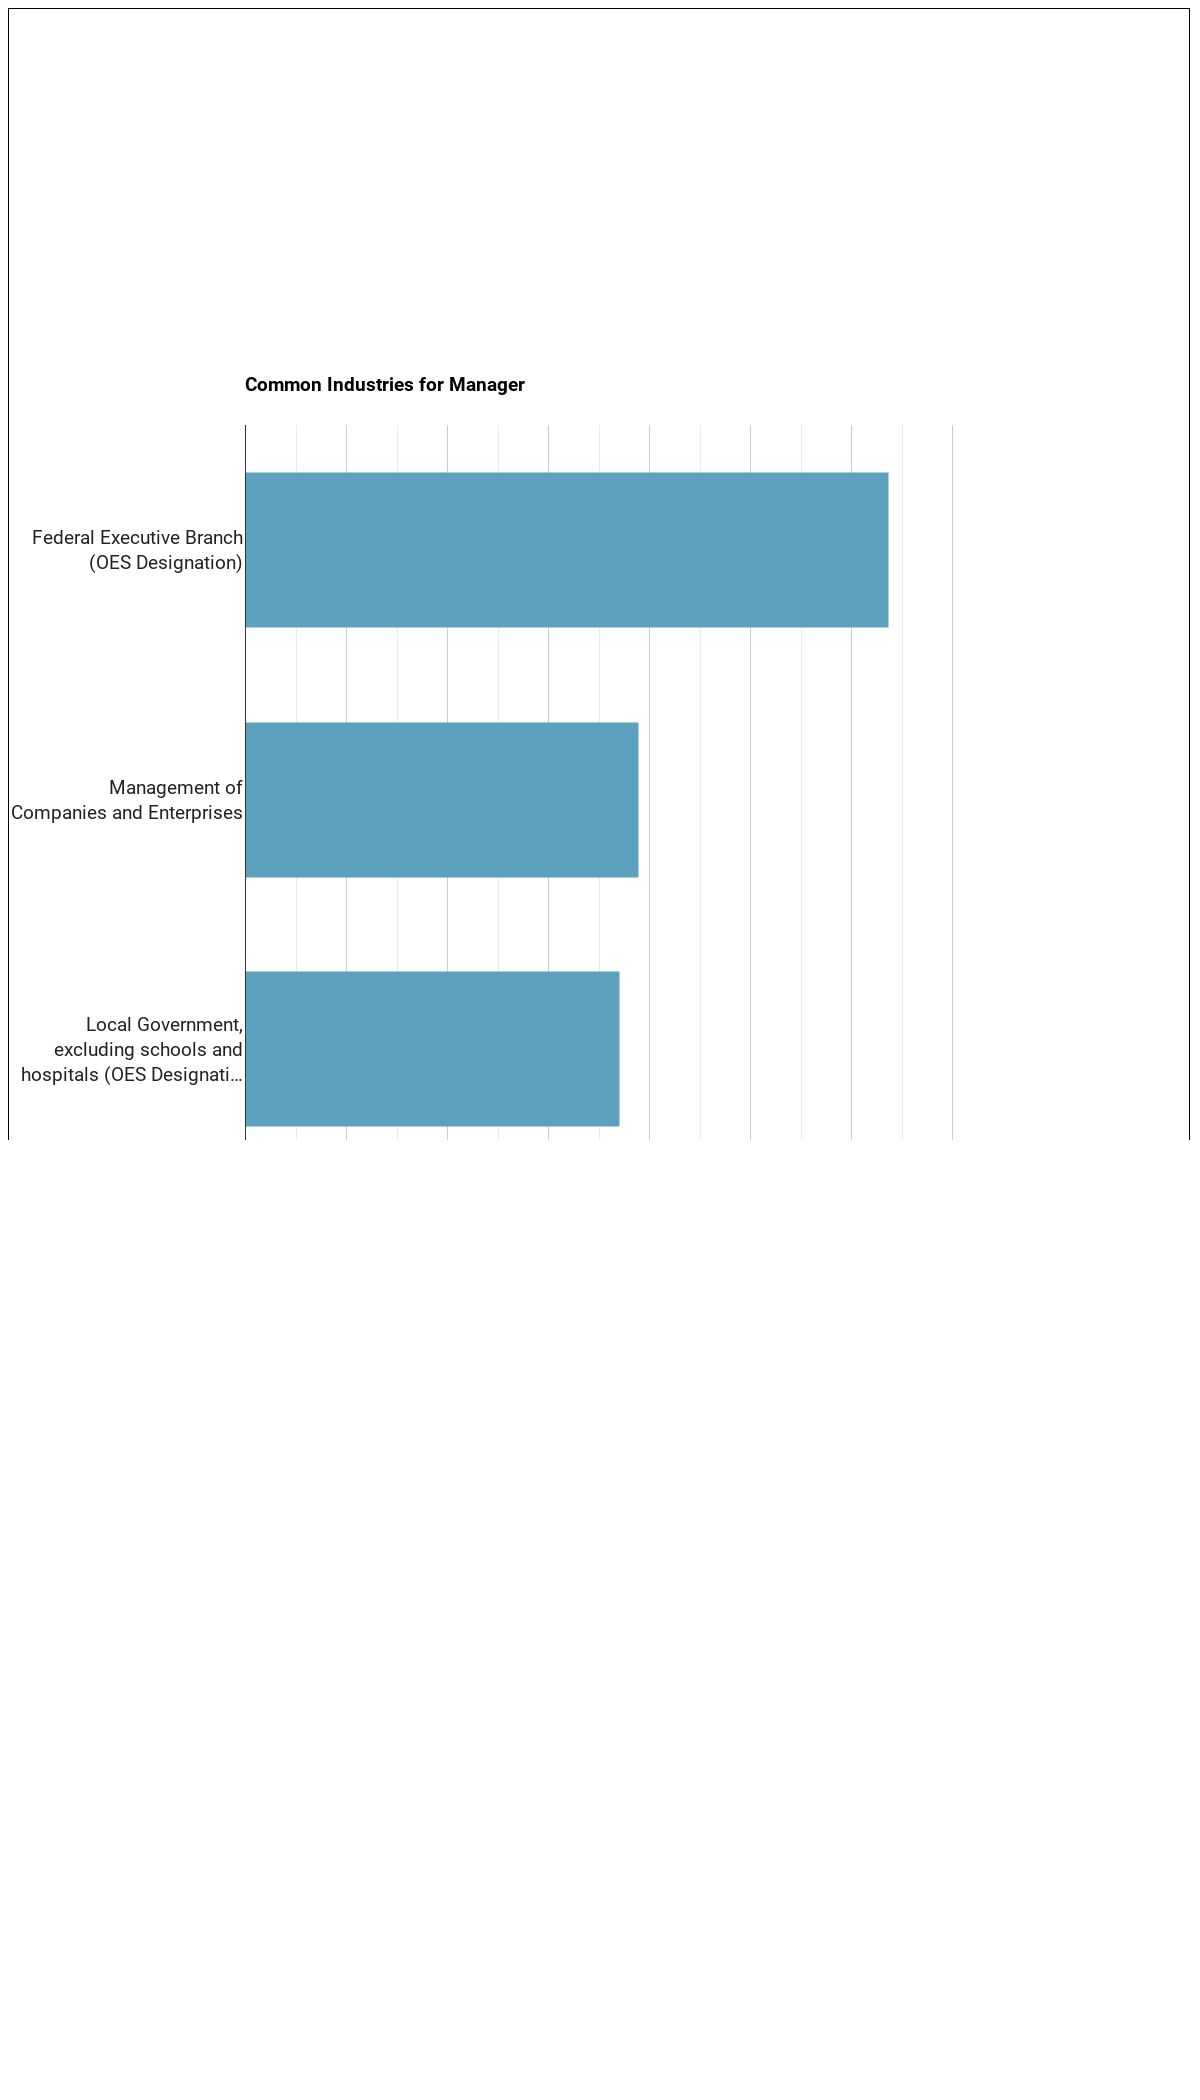
Below are examples of industries where managers, all other work:
Where to Study
Aspiring managers, all other typically earn programs in:
Social Sciences
40 programs across 14 majors
Business, Management, Marketing, and Related Support Services
15 programs across 5 majors
- Business Administration & Management
- Business & Commerce
- Entrepreneurial Studies
- Hospitality Management
- Telecommunications Management
Multi/Interdisciplinary Studies
12 programs across 10 majors
Communication, Journalism, and Related Programs
1 programs across 1 majors
Natural Resources and Conservation
1 programs across 1 majors
About the Data
This profile draws on the following authoritative sources:
- U.S. Bureau of Labor Statistics — Occupational Employment and Wage Statistics (OEWS) for employment and wage data by state and industry.
- BLS Employment Projections for total employment and growth forecasts.
- O*NET (Occupational Information Network) for skills, knowledge, tasks, work activities, work context, technology, and education-zone data.
SOC code: 11-9199.00 (Managers, All Other).
BusinessDegreeCentral.com provides higher-education, college and university, degree, program, career, salary, and other helpful information to students, faculty, institutions, and other internet audiences. Presented information and data are subject to change. Inclusion on this website does not imply or represent a direct relationship with the company, school, or brand. Information, though believed correct at time of publication, may not be correct, and no warranty is provided. Contact the schools to verify any information before relying on it. Financial aid may be available for those who qualify. The displayed options may include sponsored or recommended results, not necessarily based on your preferences.
© BusinessDegreeCentral.com – All Rights Reserved.