Financial Managers in Nebraska
Thinking about a career as a Financial Managers in Nebraska? Below are the key facts. Plan, direct, or coordinate accounting, investing, banking, insurance, securities, and other financial activities of a branch, office, or department of an establishment. Excludes “Financial Risk Specialists” (13-2054).
What do Financial Managers Make in Nebraska?
For financial managers working in Nebraska, the median annual wage is $134,410 per year (or about $64.62/hour).Annual wages span from $82,240 at the 10th percentile to $225,140 at the 90th percentile.
| Wage Statistic | Annual | Hourly |
|---|---|---|
| 10th percentile | $82,240 | $39.54 |
| 25th percentile | $104,350 | $50.17 |
| Median (50th) | $134,410 | $64.62 |
| 75th percentile | $172,320 | $82.85 |
| 90th percentile | $225,140 | $108.24 |

The job concentration index in Nebraska relative to the national average — is 1.02.
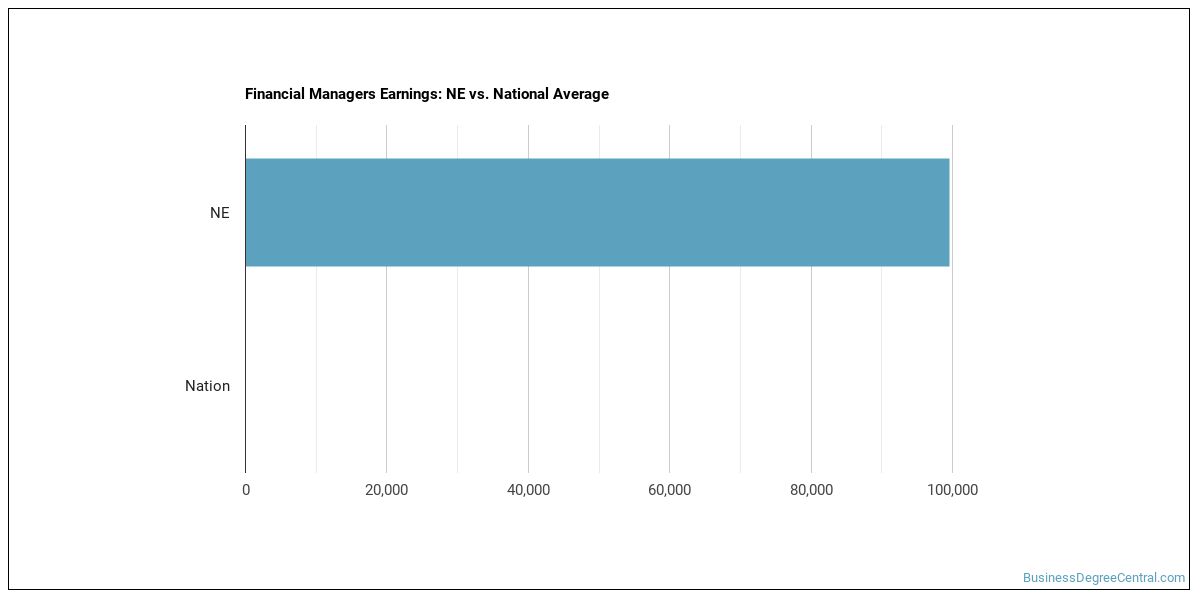
National Wage Comparison
Nationally, financial managers earn a median of $75,665 per year ($36.38/hour), exceeding the Nebraska median.
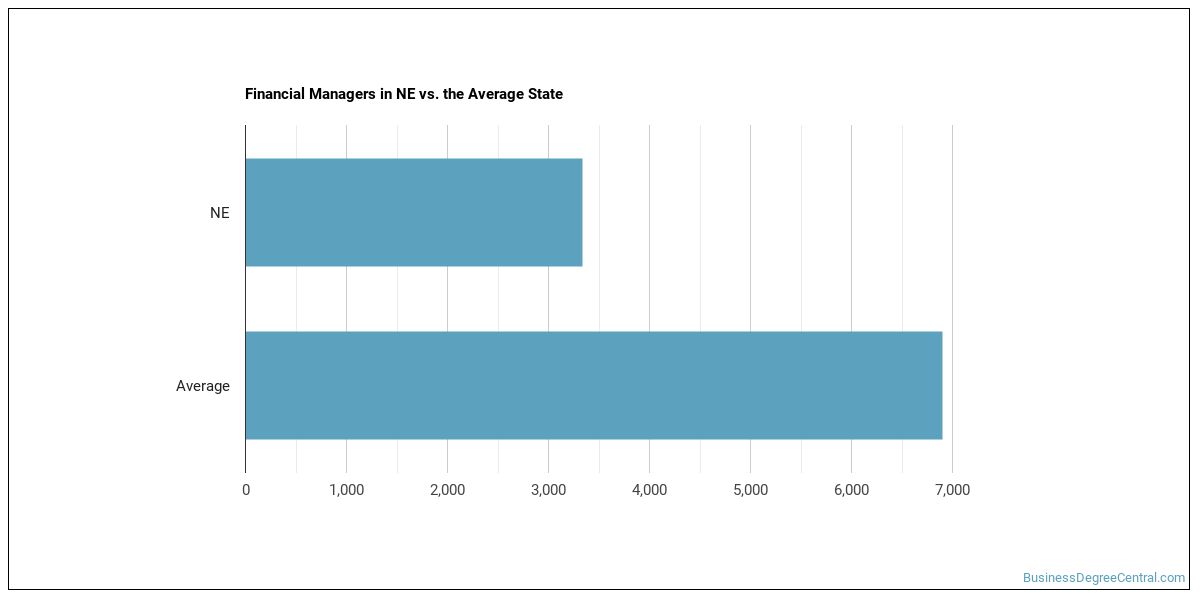
Employment Outlook
Nationally, total employment in this occupation is 133,707 financial managers across the United States. In Nebraska alone, about 5,480 people work in this role. That trails the typical state, which employs around 7,950 financial managers.

Top Nebraska Metros for Financial Managers
The largest metro-area employers of financial managers in Nebraska.
| Metro Area | Number Employed | Annual Median Salary |
|---|---|---|
| Omaha, NE-IA | 3,270 | $135,550 |
| Lincoln, NE | 920 | $127,280 |
| Grand Island, NE | 160 | $122,620 |
Top States for Financial Managers Employment
The table below shows the states where the most financial managers work.
| State | Number Employed |
|---|---|
| California | 96,860 |
| Texas | 67,580 |
| New York | 67,510 |
| Illinois | 53,400 |
| Florida | 47,710 |
| New Jersey | 32,370 |
| Pennsylvania | 31,750 |
| Ohio | 27,920 |
| Massachusetts | 27,690 |
| Georgia | 22,720 |
| North Carolina | 21,170 |
| Virginia | 20,590 |
| Connecticut | 20,200 |
| Maryland | 19,920 |
| Michigan | 19,690 |
| Tennessee | 18,650 |
| Minnesota | 16,520 |
| Arizona | 14,570 |
| Washington | 13,890 |
| Wisconsin | 13,750 |
Highest-Paying States for Financial Managers
Where financial managers earn the most: financial managers.
| State | Annual Median Salary |
|---|---|
| New York | $215,740 |
| New Jersey | $188,750 |
| District of Columbia | $181,210 |
| Massachusetts | $181,170 |
| Delaware | $180,050 |
| California | $174,920 |
| Colorado | $174,840 |
| Washington | $171,300 |
| Virginia | $170,290 |
| Connecticut | $169,730 |
Skills
Key financial managers skills, rated on an importance scale of 0 to 5:
Knowledge Areas
Key knowledge areas for this occupation, rated on an importance scale of 0 to 5:
Abilities
Key abilities for financial managers, rated on an importance scale of 0 to 5:
Daily Tasks
Day-to-day, financial managers typically:
- Establish and maintain relationships with individual or business customers or provide assistance with problems these customers may encounter.
- Oversee the flow of cash or financial instruments.
- Plan, direct, or coordinate the activities of workers in branches, offices, or departments of establishments, such as branch banks, brokerage firms, risk and insurance departments, or credit departments.
- Recruit staff members.
- Evaluate data pertaining to costs to plan budgets.
- Oversee training programs.
- Establish procedures for custody or control of assets, records, loan collateral, or securities to ensure safekeeping.
- Communicate with stockholders or other investors to provide information or to raise capital.
- Develop or analyze information to assess the current or future financial status of firms.
- Approve, reject, or coordinate the approval or rejection of lines of credit or commercial, real estate, or personal loans.
- Prepare financial or regulatory reports required by laws, regulations, or boards of directors.
- Examine, evaluate, or process loan applications.
Work Activities
- Working with Computers
- Establishing and Maintaining Interpersonal Relationships
- Communicating with Supervisors, Peers, or Subordinates
- Processing Information
- Getting Information
- Evaluating Information to Determine Compliance with Standards
- Making Decisions and Solving Problems
- Coaching and Developing Others
- Guiding, Directing, and Motivating Subordinates
- Organizing, Planning, and Prioritizing Work
- Coordinating the Work and Activities of Others
- Analyzing Data or Information
Tools & Technology
Software and systems commonly involved: Hot technologies: Adobe Acrobat, Alteryx software, IBM SPSS Statistics, Intuit QuickBooks In-demand technologies: Microsoft Excel
What Major Will Prepare You For This Career?
Programs that train for this career include:
- Finance & Financial Management
- Accounting
- Business Administration & Management
- Accounting & Computer Science
Featured schools near , edit
Related Careers
Other careers like financial managers include:
- Treasurers and Controllers
- Investment Fund Managers
- Management Analysts
- Accountants and Auditors
- Budget Analysts
- Credit Analysts
Also Known As
ATM Manager (Automated Teller Machine Manager), Accountant Supervisor, Accounting Director, Accounting Manager, Accounting Supervisor, Accounts Manager, Accounts Payable Manager, Accounts Supervisor, Actuarial Manager, Asset Manager, Auditing Manager, Auditor Supervisor, Auto Finance Manager (Automotive Finance Manager), Bank Branch Manager, Bank Manager.
References
- U.S. Bureau of Labor Statistics, Occupational Employment and Wage Statistics — https://www.bls.gov/oes/
- O*NET Online — https://www.onetonline.org/
- BLS Employment Projections — https://www.bls.gov/emp/
- O*NET-SOC code: 11-3031.00
BusinessDegreeCentral.com provides higher-education, college and university, degree, program, career, salary, and other helpful information to students, faculty, institutions, and other internet audiences. Presented information and data are subject to change. Inclusion on this website does not imply or represent a direct relationship with the company, school, or brand. Information, though believed correct at time of publication, may not be correct, and no warranty is provided. Contact the schools to verify any information before relying on it. Financial aid may be available for those who qualify. The displayed options may include sponsored or recommended results, not necessarily based on your preferences.
© BusinessDegreeCentral.com – All Rights Reserved.