Interior Design Management at University of Maryland-Baltimore County
What traits are you looking for in a school for Interior Design Management, consider the program at University of Maryland-Baltimore County. The following information will help you decide if it is a good fit for you.
University of Maryland-Baltimore County sits in Baltimore, MD.
During the most recent reporting year, 6 interior design management degrees were awarded at University of Maryland-Baltimore County.
Featured schools near , edit
Studying Online at University of Maryland-Baltimore County
Many students take online classes at University of Maryland-Baltimore County. Of 13,906 students, 580 (4%) studied exclusively online and 8,081 (58%) took at least some classes online.
Student Demographics & Diversity
Below you’ll find the student demographics for Interior Design Management graduates at University of Maryland-Baltimore County, by degree type.
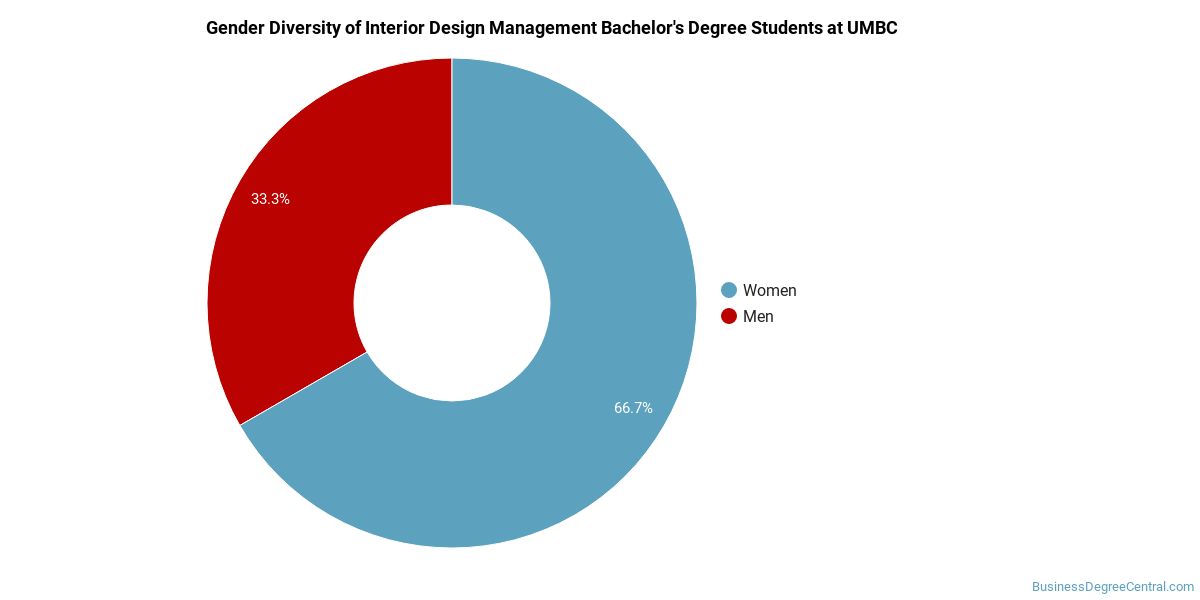
Across all degree levels, Interior Design Management graduates at University of Maryland-Baltimore County are 100% women (6) and 0% men (0).
Interior Design Management Bachelor’s Program at University of Maryland-Baltimore County
Among the 6 bachelor’s interior design management degrees awarded at University of Maryland-Baltimore County, 100% were women (6) and 0% were men (0).
The following table and chart show the race/ethnicity of Interior Design Management bachelor’s degree recipients at University of Maryland-Baltimore County.
| Race / Ethnicity | Number of Graduates |
|---|---|
| White | 3 |
| Black / African American | 1 |
| Asian | 1 |
| Two or More Races | 1 |
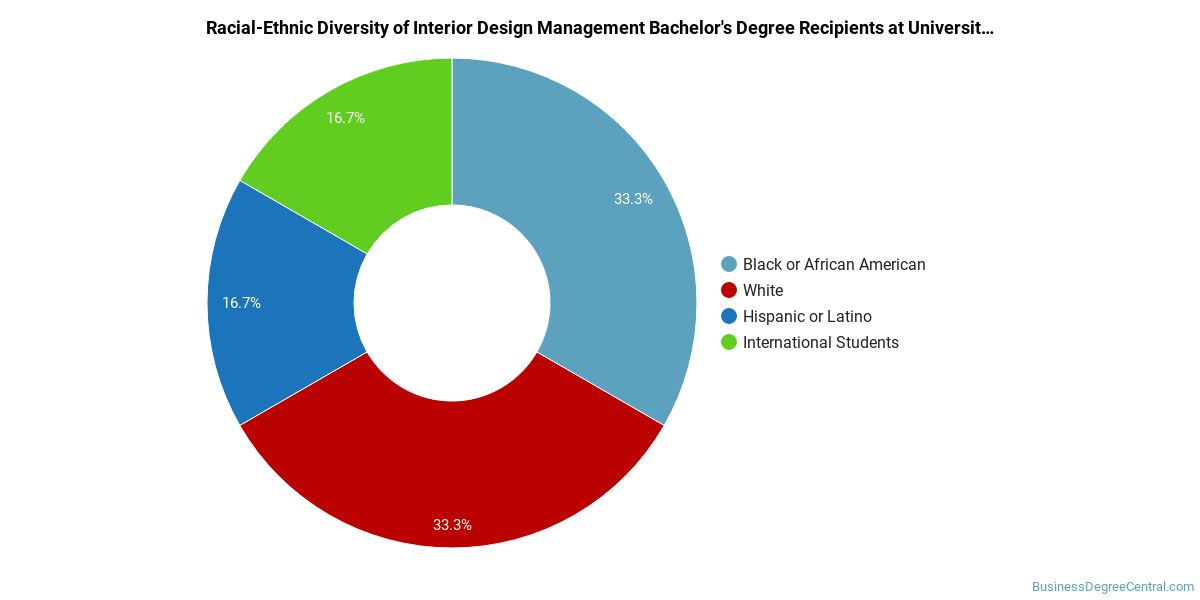
Racial-ethnic minorities make up 50% of Interior Design Management bachelor’s degree recipients at University of Maryland-Baltimore County, above the national average of 46%.*
*The racial-ethnic minorities figure is the total number of graduates minus White, international (nonresident), and unknown-race graduates.
References
- IPEDS — Integrated Postsecondary Education Data System
- U.S. Department of Education — College Scorecard
- O*NET Online (Bureau of Labor Statistics)
- National Center for Education Statistics
More about our data sources and methodologies.
BusinessDegreeCentral.com provides higher-education, college and university, degree, program, career, salary, and other helpful information to students, faculty, institutions, and other internet audiences. Presented information and data are subject to change. Inclusion on this website does not imply or represent a direct relationship with the company, school, or brand. Information, though believed correct at time of publication, may not be correct, and no warranty is provided. Contact the schools to verify any information before relying on it. Financial aid may be available for those who qualify. The displayed options may include sponsored or recommended results, not necessarily based on your preferences.
© BusinessDegreeCentral.com – All Rights Reserved.