University of Providence Business Programs
University of Providence is a private not-for-profit institution located in Great Falls, MT. A Smaller City offers tranquility and safety near the excitement of urban amenities.
Featured schools near , edit
University of Providence Rankings
Previously known as the University of Great Falls (prior to July 2018) has earned the following rankings for business programs at the bachelors level:
| Ranking | Rank | Among |
|---|---|---|
| Overall Quality | #5 of 20 | State — Montana |
| Overall Quality | #42 of 175 | Region — Rocky Mountains |
| Overall Quality | #1239 of 4,630 | Nationwide |
Where Is University of Providence?
Get in touch with Previously known as the University of Great Falls (prior to July 2018) are given below.
| Contact Details | |
|---|---|
| Address: | 1301 20th St S, Great Falls, MT 59405-4996 |
| Phone: | 4067618210 |
| Website: | www.uprovidence.edu/ |
| Admissions: | www.uprovidence.edu/admissions/ |
| Financial Aid: | www.uprovidence.edu/financial-services/ |
How Do I Get Into Previously known as the University of Great Falls (prior to July 2018)?
You can apply to Previously known as the University of Great Falls (prior to July 2018) online at: www.uprovidence.edu/explore-programs/undergraduate/apply-now/
Previously known as the University of Great Falls (prior to July 2018) is classified as Moderately Selective (50-70%) for admissions.
Admission Requirements for Previously known as the University of Great Falls (prior to July 2018)
These are the things Previously known as the University of Great Falls (prior to July 2018) looks for in applicants:
| Requirement | Status |
|---|---|
| Secondary School Record | Required |
| Secondary School GPA | Required |
| Recommendations | Neither required nor recommended |
| Admission Test Scores (SAT/ACT) | Considered but not required |
How Hard Is It To Get Into Previously known as the University of Great Falls (prior to July 2018)?
Previously known as the University of Great Falls (prior to July 2018) has an acceptance rate of 50%, which makes it fairly accessible. Be sure to prepare a complete application and prepare the application in full.
Of those admitted, 50% choose to enroll — a strong indicator that admitted students commit to enrolling.
Average Test Scores
5% of admitted students submitted SAT scores and 17% submitted ACT scores.
ACT Composite scores for admitted students at Previously known as the University of Great Falls (prior to July 2018) ranged between 15 and 23.
Selectivity by Gender
Acceptance rates at Previously known as the University of Great Falls (prior to July 2018) can differ by gender.
| Gender | Applicants | Admitted | Acceptance Rate |
|---|---|---|---|
| Men | 145 | 69 | 48% |
| Women | 207 | 108 | 52% |
Can I Afford University of Providence?
The average net price after aid at Previously known as the University of Great Falls (prior to July 2018) is $20,907. Cost varies significantly based on your financial situation since net price varies by income group.
Tuition & Fees
| Category | Cost |
|---|---|
| In-State Tuition | $30,048 |
| In-State Fees | $400 |
| Out-of-State Tuition | $30,048 |
| Out-of-State Fees | $400 |
| Total In-State Tuition & Fees | $30,448 |
| Total Out-of-State Tuition & Fees | $30,448 |
Financial Aid
Counting all forms of financial assistance, 19% of students at Previously known as the University of Great Falls (prior to July 2018) receive some form of financial aid (109 students).
Nearly 80% of students at Previously known as the University of Great Falls (prior to July 2018) receive grant or scholarship aid, averaging $21,623 per student.
33% of students receive federal Pell Grants, averaging $5,983.
Student Loan Debt
48% of Previously known as the University of Great Falls (prior to July 2018) undergraduates take out federal student loans, averaging $8,375 per year.
University of Providence Undergraduate Student Diversity
There are 399 students enrolled at Previously known as the University of Great Falls (prior to July 2018). Previously known as the University of Great Falls (prior to July 2018) is classified as a Under 1,000 institution by enrollment size. Its Carnegie Classification is Master’s Colleges & Universities: Small Programs.
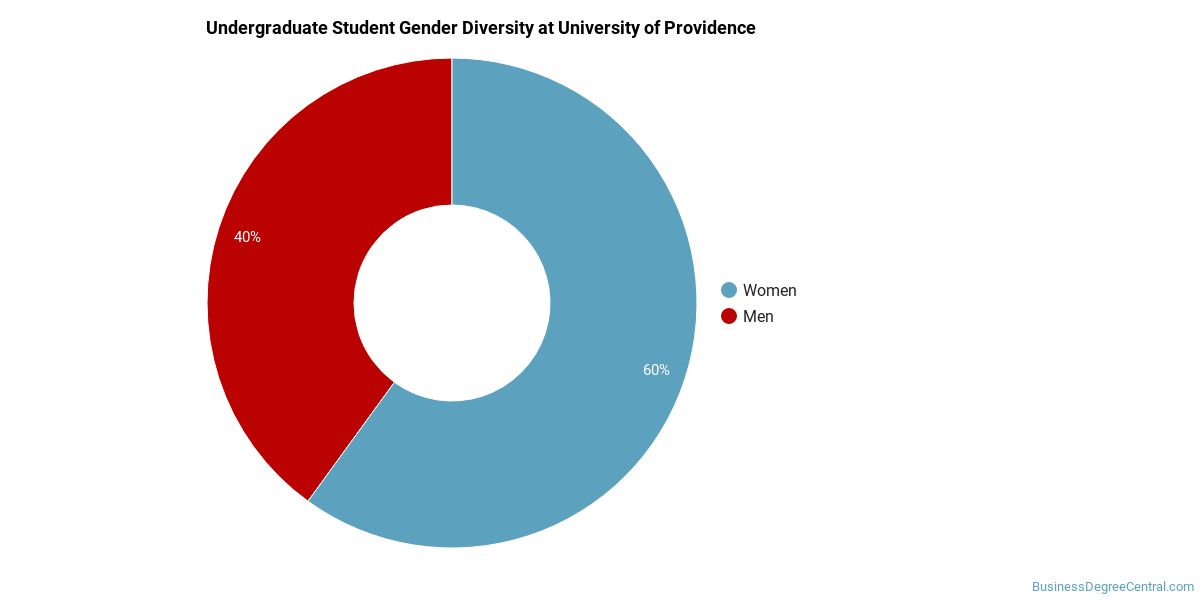
Gender Diversity
Of the 527 undergraduate students at Previously known as the University of Great Falls (prior to July 2018), approximately 38% are male and 62% are female.
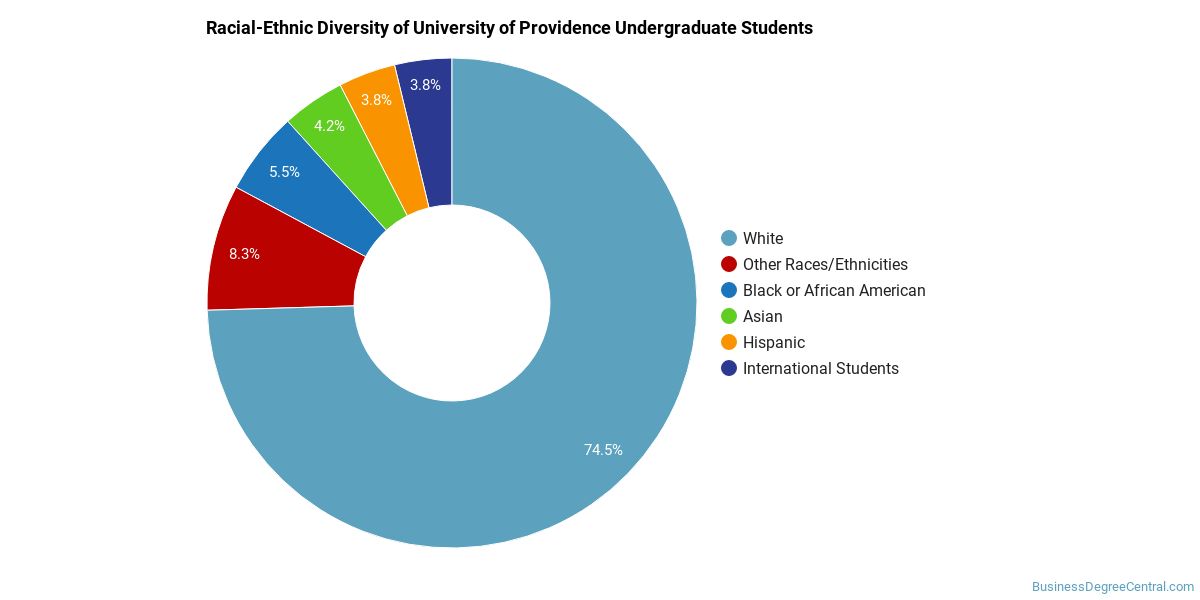
Racial-Ethnic Diversity
The racial-ethnic breakdown of University of Providence undergraduate students is as follows.
| Race/Ethnicity | Number of Students |
|---|---|
| Asian | 24 |
| Black or African American | 31 |
| Hispanic | 26 |
| White | 376 |
| American Indian/Alaska Native | 14 |
| Native Hawaiian/Pacific Islander | 6 |
| Non-Resident | 17 |
Geographic Diversity
The top 5 home states of first-time undergraduate students at Previously known as the University of Great Falls (prior to July 2018) are listed below.

| State | First-Time UG Students |
|---|---|
| Montana | 36 |
| Washington | 9 |
| California | 6 |
| Idaho | 3 |
| Texas | 3 |
Additionally, approximately 3.4% of undergraduate students are non-resident from outside the United States.
University of Providence Graduate Student Diversity
115 of Previously known as the University of Great Falls (prior to July 2018)’s students are in graduate programs. The highest graduate-level award offered is Master’s degree.
Gender Diversity (Graduate)
Among graduate students at Previously known as the University of Great Falls (prior to July 2018), approximately 22% are male and 78% are female.

Racial-Ethnic Diversity (Graduate)
The racial-ethnic breakdown of University of Providence graduate students is as follows.

| Race/Ethnicity | Number of Students |
|---|---|
| Asian | 4 |
| Black or African American | 3 |
| White | 71 |
| American Indian/Alaska Native | 0 |
Online Learning at University of Providence
Previously known as the University of Great Falls (prior to July 2018) provides remote learning paths for students who need flexibility.
94 undergraduate students at Previously known as the University of Great Falls (prior to July 2018) took at least one online class — of those, 159 took all of their classes online.
At the graduate level, 0 students took at least one online class and 173 took all classes online. Distance education is available at the undergraduate and graduate levels.
Business Programs at University of Providence
Below are the business majors are available at Previously known as the University of Great Falls (prior to July 2018), showing degrees awarded by level in the most recent reporting year.
| Program | Bachelor’s | Master’s | Doctorate | Total |
|---|---|---|---|---|
| Business Administration, Management and Operations | 14 | 8 | — | 22 |
| Business, Management, Marketing, and Related Support Services, Other | 1 | 4 | — | 5 |
Academic Programs at University of Providence
Previously known as the University of Great Falls (prior to July 2018) offers 12 distinct academic programs.
The highest level of award offered is Master’s degree.
Institutional Profile
Previously known as the University of Great Falls (prior to July 2018) has an open admission policy: No. Credit transfer:
- AP credits: Yes
- Dual enrollment credits: Yes
- Life experience credits: Implied no
References
More about our data sources and methodologies.
Featured Schools

You have goals. Southern New Hampshire University can help you get there. Whether you need a bachelor's degree to get into a career or want a master's degree to move up in your current career, SNHU has an online program for you. Find your degree from over 200 online programs.
Visit SchoolBusinessDegreeCentral.com provides higher-education, college and university, degree, program, career, salary, and other helpful information to students, faculty, institutions, and other internet audiences. Presented information and data are subject to change. Inclusion on this website does not imply or represent a direct relationship with the company, school, or brand. Information, though believed correct at time of publication, may not be correct, and no warranty is provided. Contact the schools to verify any information before relying on it. Financial aid may be available for those who qualify. The displayed options may include sponsored or recommended results, not necessarily based on your preferences.
© BusinessDegreeCentral.com – All Rights Reserved.