University of Evansville Business Programs
University of Evansville is a private not-for-profit institution located in Evansville, IN. A Mid-Sized City provides a peaceful environment close to urban amenities.
Featured schools near , edit
University of Evansville Rankings
University of Evansville appears in the following rankings for business programs at the bachelors level:
| Ranking | Rank | Among |
|---|---|---|
| Overall Quality | #23 of 89 | State — Indiana |
| Overall Quality | #164 of 719 | Region — Great Lakes |
| Overall Quality | #986 of 4,630 | Nationwide |
Where Is University of Evansville?
Contact information for University of Evansville are listed below.
| Contact Details | |
|---|---|
| Address: | 1800 Lincoln Avenue, Evansville, IN 47722 |
| Phone: | 8124882000 |
| Website: | www.evansville.edu/ |
| Admissions: | www.evansville.edu/admission/ |
| Financial Aid: | www.evansville.edu/student-financial-services/ |
How Do I Get Into University of Evansville?
You can apply to University of Evansville online at: https://apply2.evansville.edu/apply/
University of Evansville is classified as Less Selective (70-85%) for admissions.
Admission Requirements for University of Evansville
These are the things University of Evansville requires for admission:
| Requirement | Status |
|---|---|
| Secondary School Record | Required |
| Secondary School GPA | Required |
| Recommendations | Considered but not required |
| Admission Test Scores (SAT/ACT) | Neither required nor recommended |
How Hard Is It To Get Into University of Evansville?
University of Evansville admits 78%, making it highly accessible. Take time to make sure you submit all the requested materials and prepare the application in full.
Of those admitted, 11% choose to enroll — a modest enrollment yield, suggesting many admitted students choose other institutions.
Average Test Scores
Selectivity by Gender
Admit rates at University of Evansville vary modestly across gender.
| Gender | Applicants | Admitted | Acceptance Rate |
|---|---|---|---|
| Men | 1,991 | 1,525 | 77% |
| Women | 2,887 | 2,286 | 79% |
Can I Afford University of Evansville?
The average net price after aid at University of Evansville is $20,230. The affordability of the school largely depends on your financial need since net price varies by income group.
Tuition & Fees
| Category | Cost |
|---|---|
| In-State Tuition | $42,800 |
| In-State Fees | $1,372 |
| Out-of-State Tuition | $42,800 |
| Out-of-State Fees | $1,372 |
| Total In-State Tuition & Fees | $44,172 |
| Total Out-of-State Tuition & Fees | $44,172 |
Financial Aid
When including loans, work-study, and grants, 27% of students at University of Evansville receive some form of financial aid (462 students).
About 86% of students at University of Evansville receive grant or scholarship aid, averaging $34,952 per student.
24% of students receive federal Pell Grants, averaging $5,712.
Student Loan Debt
41% of University of Evansville undergraduates take out federal student loans, averaging $6,539 per year.
University of Evansville Undergraduate Student Diversity
There are 420 students enrolled at University of Evansville. University of Evansville is classified as a 1,000 - 4,999 institution by enrollment size. Its Carnegie Classification is Master’s Colleges & Universities: Medium Programs.
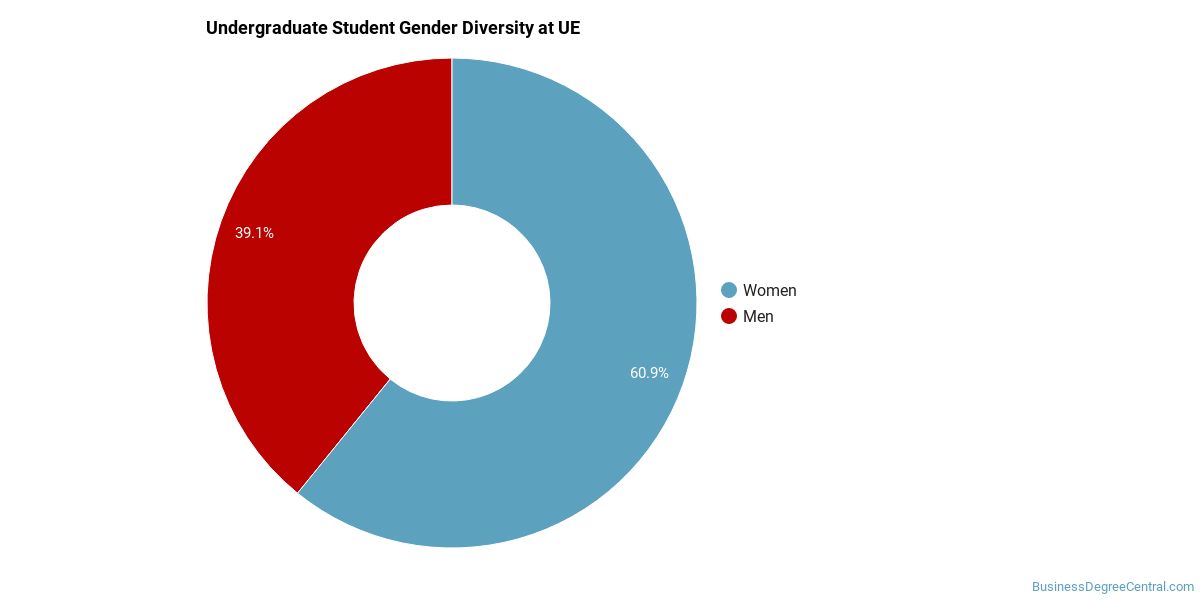
Gender Diversity
Of the 1,477 undergraduate students at University of Evansville, approximately 40% are male and 60% are female.
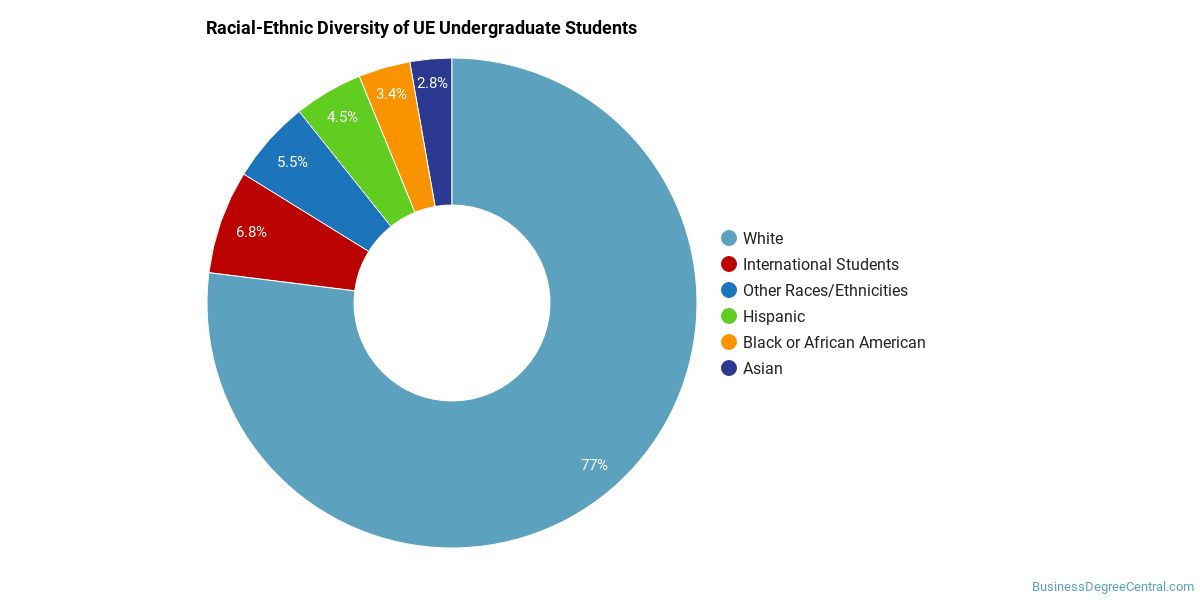
Racial-Ethnic Diversity
The racial-ethnic breakdown of University of Evansville undergraduate students is as follows.
| Race/Ethnicity | Number of Students |
|---|---|
| Asian | 42 |
| Black or African American | 66 |
| Hispanic | 90 |
| White | 1,066 |
| American Indian/Alaska Native | 1 |
| Native Hawaiian/Pacific Islander | 1 |
| Two or More Races | 64 |
| Non-Resident | 97 |
Geographic Diversity
The top 5 home states of first-time undergraduate students at University of Evansville are listed below.

| State | First-Time UG Students |
|---|---|
| Indiana | 264 |
| Illinois | 41 |
| Kentucky | 23 |
| Texas | 15 |
| Ohio | 9 |
Additionally, approximately 6.6% of undergraduate students are non-resident from outside the United States.
University of Evansville Graduate Student Diversity
368 of University of Evansville’s students are in graduate programs. The highest graduate-level award offered is Doctor’s degree.
Gender Diversity (Graduate)
Among graduate students at University of Evansville, approximately 30% are male and 70% are female.

Racial-Ethnic Diversity (Graduate)
The racial-ethnic breakdown of University of Evansville graduate students is as follows.

| Race/Ethnicity | Number of Students |
|---|---|
| Asian | 15 |
| Black or African American | 11 |
| Hispanic | 20 |
| White | 303 |
| Two or More Races | 11 |
| Non-Resident | 4 |
Online Learning at University of Evansville
University of Evansville provides online programs for students who need flexibility.
612 undergraduate students at University of Evansville took at least one online class — of those, 28 took all of their classes online.
At the graduate level, 65 students took at least one online class and 32 took all classes online. Distance education is available at the undergraduate and graduate levels.
Business Programs at University of Evansville
The following business programs are offered at University of Evansville, showing degrees awarded by level in the most recent reporting year.
| Program | Bachelor’s | Master’s | Doctorate | Total |
|---|---|---|---|---|
| Business Administration, Management and Operations | 25 | 15 | — | 40 |
| Accounting and Related Services | 17 | — | — | 17 |
| Finance and Financial Management Services | 13 | — | — | 13 |
| Marketing | 12 | — | — | 12 |
| Management Sciences and Quantitative Methods | 2 | — | — | 2 |
| Business/Commerce, General | 1 | — | — | 1 |
| International Business | 1 | — | — | 1 |
Academic Programs at University of Evansville
University of Evansville offers 21 distinct academic programs.
The highest level of award offered is Doctor’s degree.
Institutional Profile
University of Evansville maintains an open admission policy: No. Credit transfer:
- AP credits: Yes
- Dual enrollment credits: Yes
- Life experience credits: Implied no
References
More about our data sources and methodologies.
Featured Schools

You have goals. Southern New Hampshire University can help you get there. Whether you need a bachelor's degree to get into a career or want a master's degree to move up in your current career, SNHU has an online program for you. Find your degree from over 200 online programs.
Visit SchoolBusinessDegreeCentral.com provides higher-education, college and university, degree, program, career, salary, and other helpful information to students, faculty, institutions, and other internet audiences. Presented information and data are subject to change. Inclusion on this website does not imply or represent a direct relationship with the company, school, or brand. Information, though believed correct at time of publication, may not be correct, and no warranty is provided. Contact the schools to verify any information before relying on it. Financial aid may be available for those who qualify. The displayed options may include sponsored or recommended results, not necessarily based on your preferences.
© BusinessDegreeCentral.com – All Rights Reserved.