Business Management & Marketing at Susquehanna University
If you plan to study Business Management & Marketing, take a look at what Susquehanna University. The following information will help you decide if it is a good fit for you.
Susquehanna University is in Selinsgrove, PA.
During the most recent reporting year, 10 business management & marketing degrees were awarded at Susquehanna University.
Featured schools near , edit
Online Class Availability at Susquehanna University
Susquehanna University primarily offers on-campus instruction; distance-education enrollment is limited.
Business Management & Marketing Rankings at Susquehanna University
These rankings give you a sense of how Susquehanna University’s Business Management & Marketing program against other schools offering the same major.
Bachelor’s-Level Rankings
| Ranking | Scope | Rank |
|---|---|---|
| Best Value | Pennsylvania | #4 of 6 |
| Best Schools (Quality) | Pennsylvania | #6 of 7 |
| Best Value | Middle Atlantic (Region) | #7 of 13 |
| Best Schools (Quality) | Middle Atlantic (Region) | #11 of 14 |
| Best Value | Nationwide | #31 of 48 |
| Best Schools (Quality) | Nationwide | #37 of 50 |
Student Demographics & Diversity
The following sections describe the diversity of Business Management & Marketing graduates at Susquehanna University, by degree type.
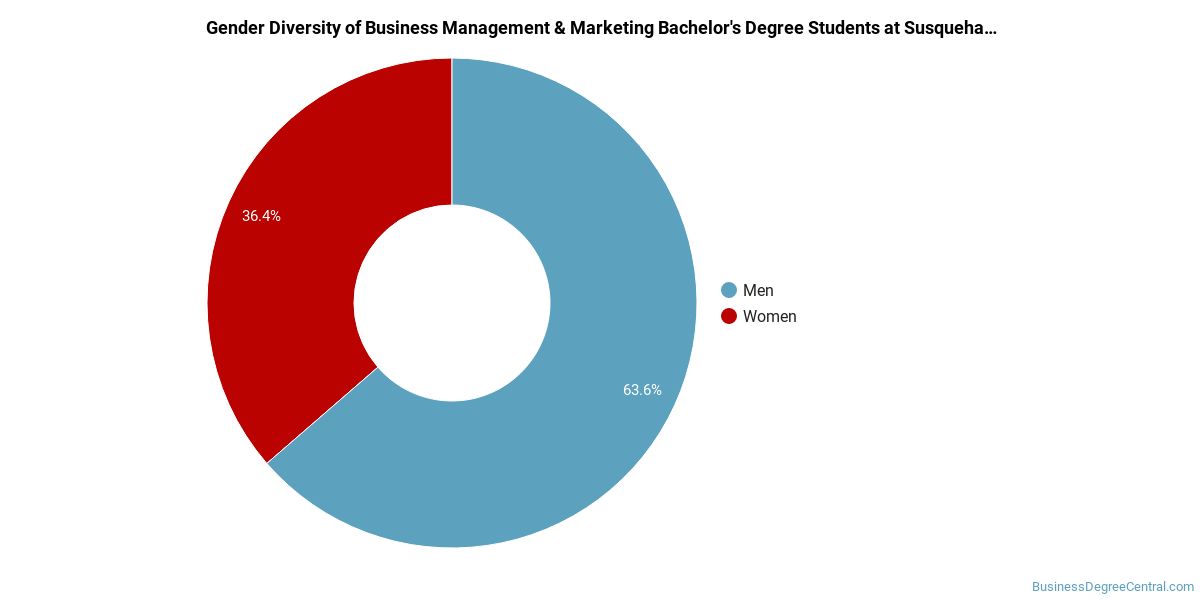
Program-wide, Business Management & Marketing graduates at Susquehanna University are 60% women (6) and 40% men (4).
Business Management & Marketing Bachelor’s Program at Susquehanna University
Of the 10 bachelor’s business management & marketing degrees awarded at Susquehanna University, 60% were women (6) and 40% were men (4).
The following table and chart show the race/ethnicity of Business Management & Marketing bachelor’s degree recipients at Susquehanna University.
| Race / Ethnicity | Number of Graduates |
|---|---|
| White | 7 |
| Hispanic / Latino | 2 |
| Asian | 1 |
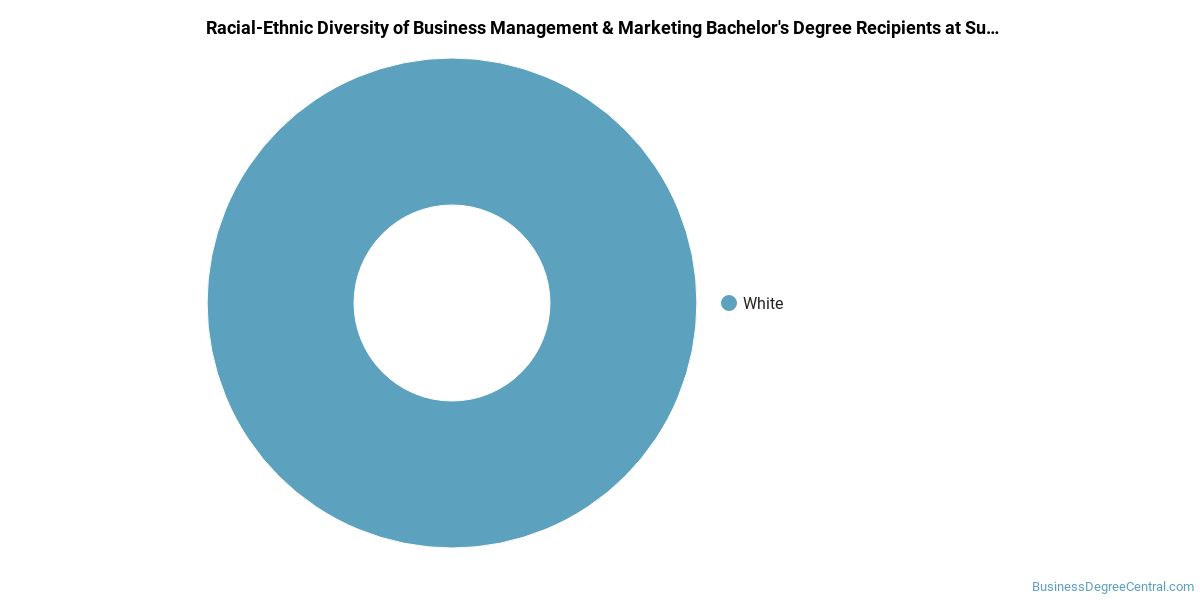
Minority students account for 30% of Business Management & Marketing bachelor’s degree recipients at Susquehanna University, below the national average of 36%.*
*The racial-ethnic minorities figure is the total number of graduates minus White, international (nonresident), and unknown-race graduates.
References
- IPEDS — Integrated Postsecondary Education Data System
- U.S. Department of Education — College Scorecard
- O*NET Online (Bureau of Labor Statistics)
- National Center for Education Statistics
More about our data sources and methodologies.
BusinessDegreeCentral.com provides higher-education, college and university, degree, program, career, salary, and other helpful information to students, faculty, institutions, and other internet audiences. Presented information and data are subject to change. Inclusion on this website does not imply or represent a direct relationship with the company, school, or brand. Information, though believed correct at time of publication, may not be correct, and no warranty is provided. Contact the schools to verify any information before relying on it. Financial aid may be available for those who qualify. The displayed options may include sponsored or recommended results, not necessarily based on your preferences.
© BusinessDegreeCentral.com – All Rights Reserved.