Interior Design Management at St. Thomas University
If you are interested in studying Interior Design Management, take a look at what St. Thomas University. Get started with the following essential facts.
St. Thomas University is in Miami Gardens, FL.
In the most recent year for which we have data, 72 interior design management graduations were recorded at St. Thomas University.
Featured schools near , edit
Online Class Availability at St. Thomas University
Many students take online classes at St. Thomas University. Among 7,652 students, 2,271 (30%) studied exclusively online and 1,349 (18%) took at least some classes online.
Interior Design Management Rankings at St. Thomas University
Use these rankings to compare St. Thomas University’s Interior Design Management program against other schools offering the same major.
Bachelor’s-Level Rankings
| Ranking | Scope | Rank |
|---|---|---|
| Best Schools (Quality) | Florida | #13 of 24 |
| Best Value | Florida | #25 of 28 |
| Best Schools (Quality) | Southeast (Region) | #37 of 60 |
| Best Value | Southeast (Region) | #85 of 97 |
| Best Schools (Quality) | Nationwide | #116 of 166 |
| Best Value | Nationwide | #245 of 325 |
Master’s-Level Rankings
| Ranking | Scope | Rank |
|---|---|---|
| Best Schools (Quality) | Florida | #13 of 24 |
| Best Value | Florida | #25 of 28 |
| Best Schools (Quality) | Southeast (Region) | #37 of 60 |
| Best Value | Southeast (Region) | #85 of 97 |
| Best Schools (Quality) | Nationwide | #116 of 166 |
| Best Value | Nationwide | #245 of 325 |
Doctoral-Level Rankings
| Ranking | Scope | Rank |
|---|---|---|
| Best Schools (Quality) | Florida | #13 of 24 |
| Best Value | Florida | #25 of 28 |
| Best Schools (Quality) | Southeast (Region) | #37 of 60 |
| Best Value | Southeast (Region) | #85 of 97 |
| Best Schools (Quality) | Nationwide | #116 of 166 |
| Best Value | Nationwide | #245 of 325 |
Student Demographics & Diversity
The following sections describe the student demographics for Interior Design Management graduates at St. Thomas University, by degree type.
Program-wide, Interior Design Management graduates at St. Thomas University are 22% women (16) and 78% men (56).
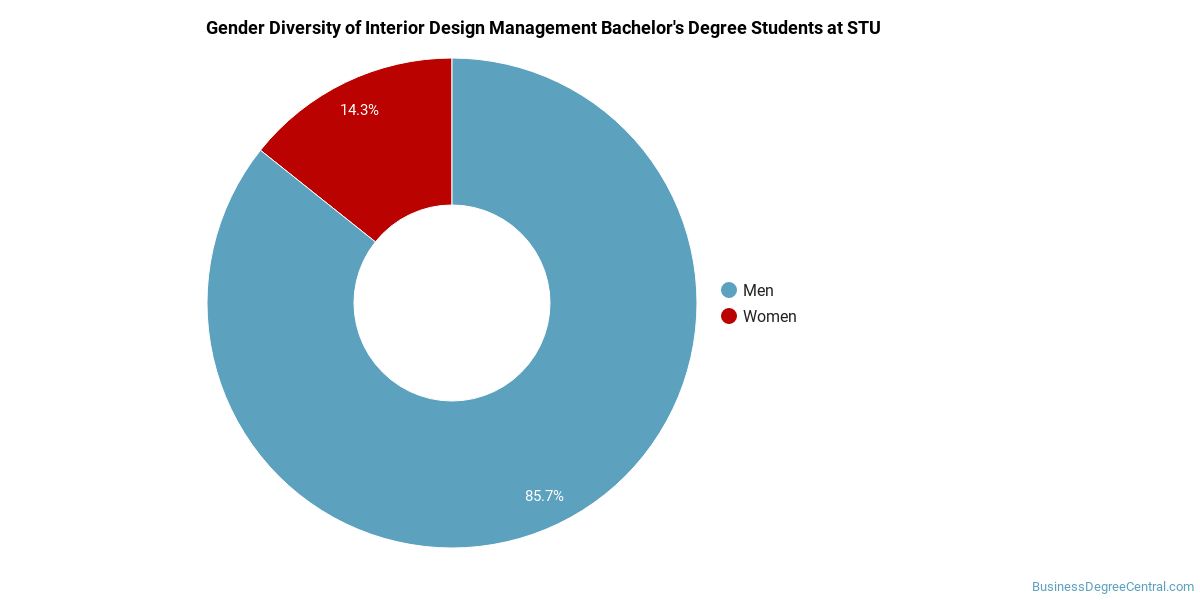
Interior Design Management Bachelor’s Program at St. Thomas University
Among the 53 bachelor’s interior design management graduates at St. Thomas University, 23% were women (12) and 77% were men (41).
The following table and chart show the race/ethnicity of Interior Design Management bachelor’s degree recipients at St. Thomas University.
| Race / Ethnicity | Number of Graduates |
|---|---|
| White | 14 |
| Hispanic / Latino | 14 |
| Black / African American | 14 |
| Two or More Races | 2 |
| International (Nonresident) | 9 |
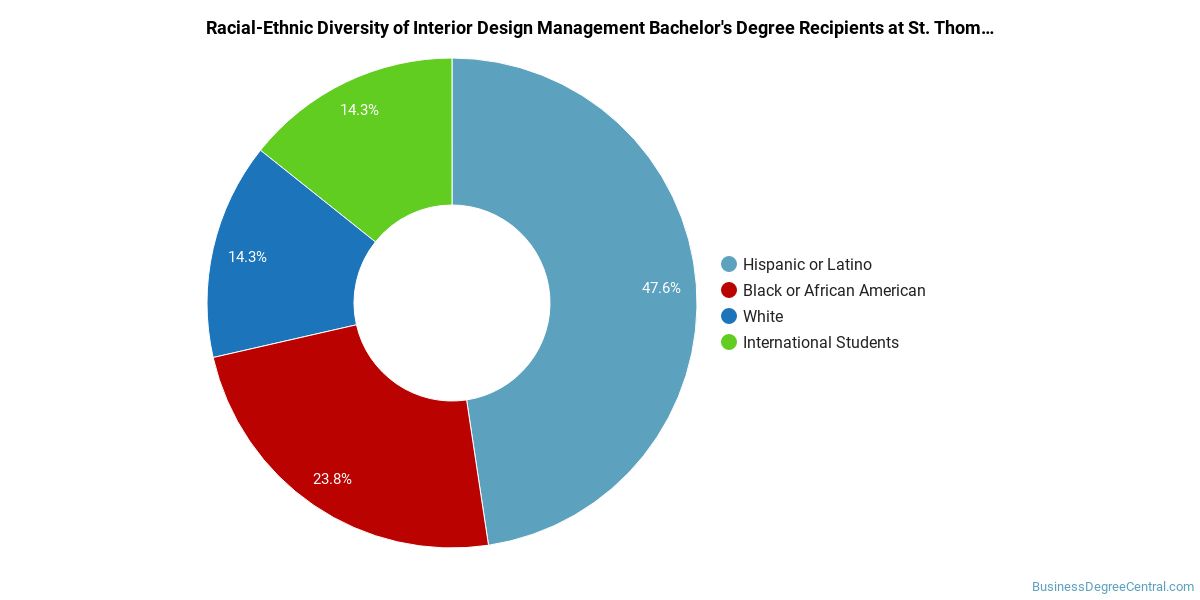
Racial-ethnic minorities make up 57% of Interior Design Management bachelor’s degree recipients at St. Thomas University, above the national average of 46%.*
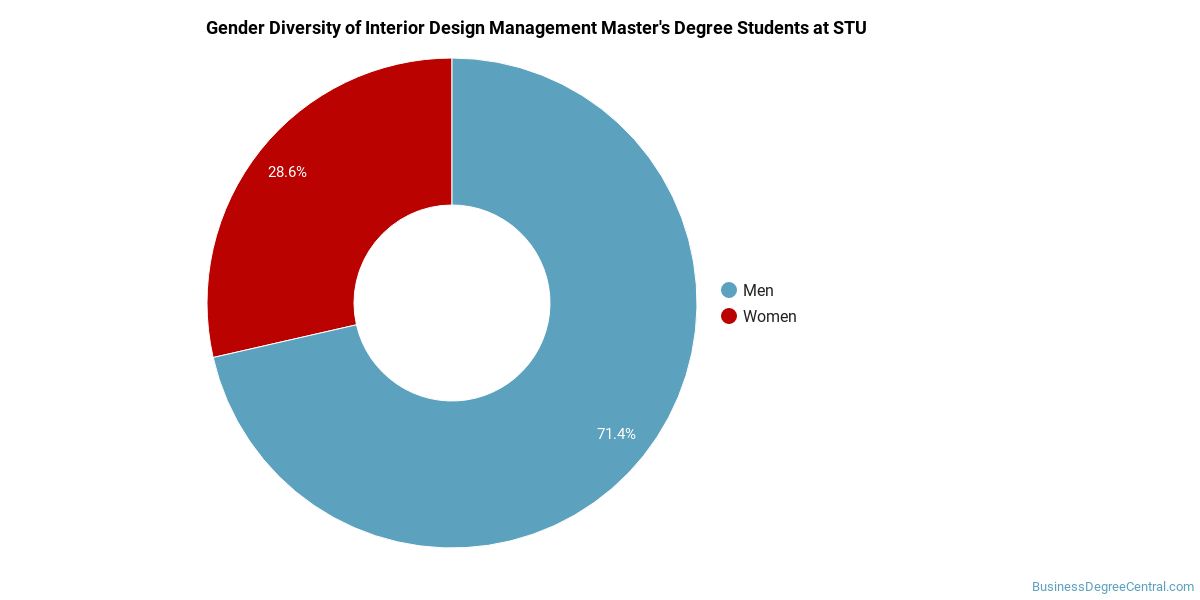
Interior Design Management Master’s Program at St. Thomas University
Among the 15 master’s interior design management degrees awarded at St. Thomas University, 13% were women (2) and 87% were men (13).
The following table and chart show the race/ethnicity of Interior Design Management master’s degree recipients at St. Thomas University.
| Race / Ethnicity | Number of Graduates |
|---|---|
| White | 2 |
| Hispanic / Latino | 3 |
| Black / African American | 6 |
| International (Nonresident) | 3 |
| Unknown | 1 |
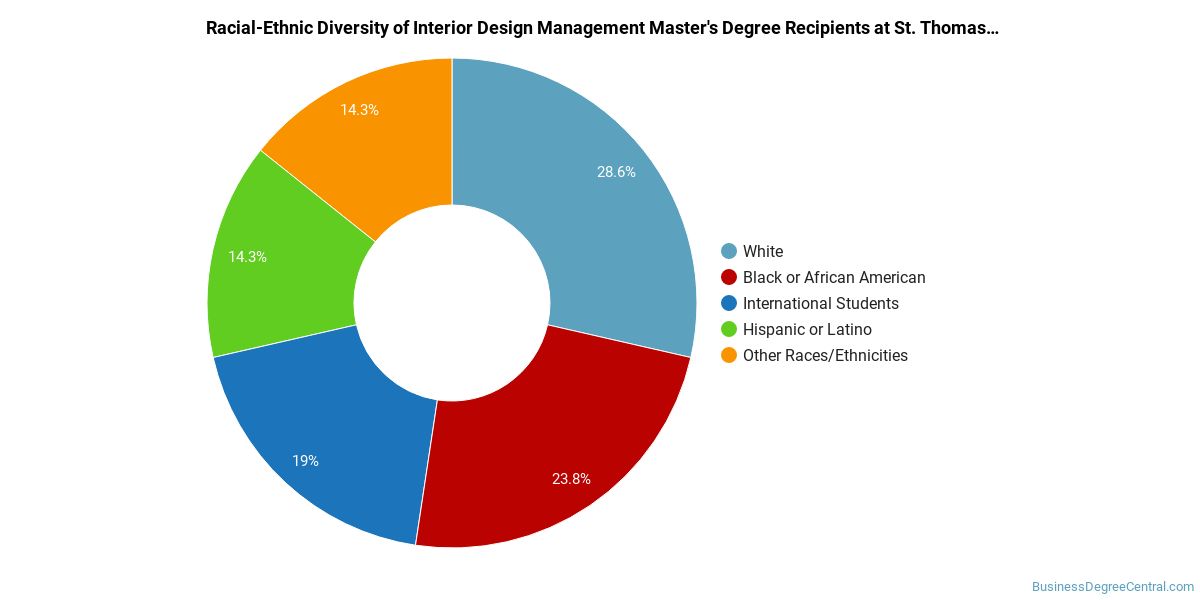
Racial-ethnic minorities make up 60% of Interior Design Management master’s degree recipients at St. Thomas University, above the national average of 35%.*
Interior Design Management Doctoral Program at St. Thomas University
Among the 4 doctoral interior design management graduates at St. Thomas University, 50% were women (2) and 50% were men (2).

The following table and chart show the race/ethnicity of Interior Design Management doctoral degree recipients at St. Thomas University.
| Race / Ethnicity | Number of Graduates |
|---|---|
| Hispanic / Latino | 2 |
| Black / African American | 1 |
| International (Nonresident) | 1 |

Racial-ethnic minorities make up 75% of Interior Design Management doctoral degree recipients at St. Thomas University, below the national average of 86%.*
*The racial-ethnic minorities figure is the total number of graduates minus White, international (nonresident), and unknown-race graduates.
References
- IPEDS — Integrated Postsecondary Education Data System
- U.S. Department of Education — College Scorecard
- O*NET Online (Bureau of Labor Statistics)
- National Center for Education Statistics
More about our data sources and methodologies.
BusinessDegreeCentral.com provides higher-education, college and university, degree, program, career, salary, and other helpful information to students, faculty, institutions, and other internet audiences. Presented information and data are subject to change. Inclusion on this website does not imply or represent a direct relationship with the company, school, or brand. Information, though believed correct at time of publication, may not be correct, and no warranty is provided. Contact the schools to verify any information before relying on it. Financial aid may be available for those who qualify. The displayed options may include sponsored or recommended results, not necessarily based on your preferences.
© BusinessDegreeCentral.com – All Rights Reserved.