Riverside City College Business Programs
Riverside City College is a public institution located in Riverside, CA. A Major City Center offers a peaceful environment close to urban amenities.
Featured schools near , edit
Where Is Riverside City College?
Get in touch with Riverside City College are listed below.
| Contact Details | |
|---|---|
| Address: | 4800 Magnolia Avenue, Riverside, CA 92506 |
| Phone: | 95122280008979 |
| Website: | www.rcc.edu/ |
| Admissions: | www.rcc.edu/become-a-student/index.html |
| Financial Aid: | www.rcc.edu/become-a-student/how-to-pay-for-school/financial-aid.html |
How Do I Get Into Riverside City College?
You can apply to Riverside City College online at: www.rcc.edu/become-a-student/index.html
How Hard Is It To Get Into Riverside City College?
Average Test Scores
Can I Afford Riverside City College?
The average net price after aid at Riverside City College is $4,026. Your actual cost will depend on your family’s circumstances since net price varies by income group.
Tuition & Fees
| Category | Cost |
|---|---|
| In-State Tuition | $1,380 |
| In-State Fees | $48 |
| Out-of-State Tuition | $12,450 |
| Out-of-State Fees | $48 |
| Total In-State Tuition & Fees | $1,428 |
| Total Out-of-State Tuition & Fees | $12,498 |
Financial Aid
Counting all forms of financial assistance, 11% of students at Riverside City College receive some form of financial aid (2,171 students).
Approximately 64% of students at Riverside City College receive grant or scholarship aid, averaging $4,162 per student.
34% of students receive federal Pell Grants, averaging $4,288.
Student Loan Debt
1% of Riverside City College undergraduates take out federal student loans, averaging $6,564 per year.
Riverside City College Undergraduate Student Diversity
Its Carnegie Classification is Associate’s Colleges: High Transfer-High Traditional.
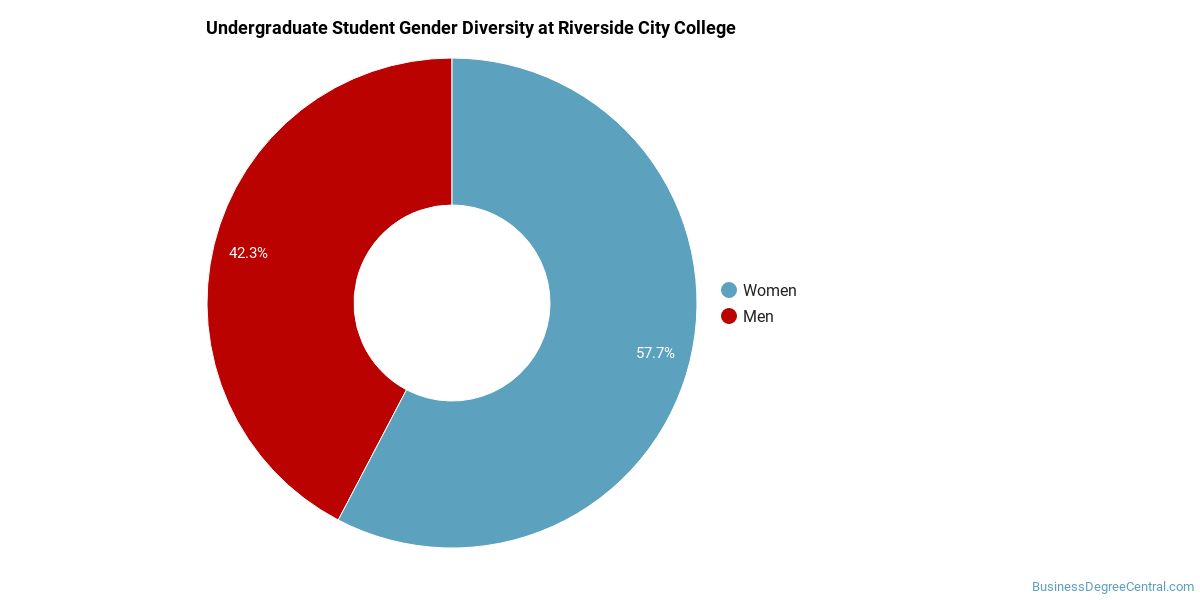
Gender Diversity
Of the 17,361 undergraduate students at Riverside City College, approximately 41% are male and 59% are female.
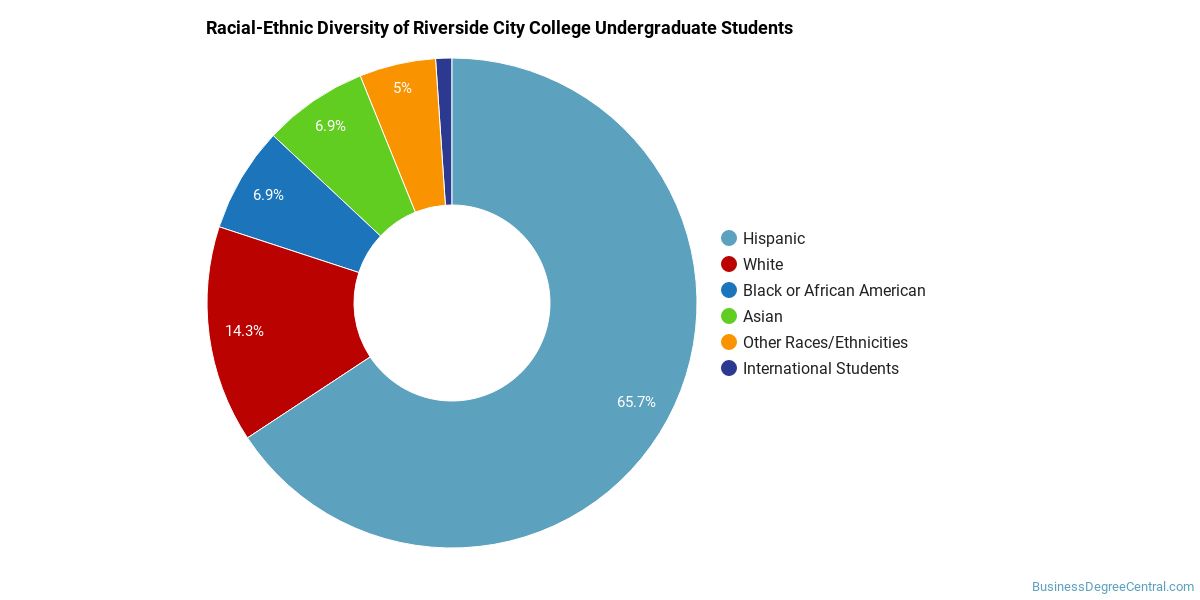
Racial-Ethnic Diversity
The racial-ethnic breakdown of Riverside City College undergraduate students is as follows.
| Race/Ethnicity | Number of Students |
|---|---|
| Asian | 1,059 |
| Black or African American | 1,215 |
| Hispanic | 11,857 |
| White | 2,222 |
| American Indian/Alaska Native | 34 |
| Native Hawaiian/Pacific Islander | 52 |
| Two or More Races | 746 |
| Non-Resident | 86 |
Geographic Diversity
The top 5 home states of first-time undergraduate students at Riverside City College are shown below.

| State | First-Time UG Students |
|---|---|
| California | 4,348 |
Additionally, approximately 0.5% of undergraduate students are non-resident from outside the United States.
Online Learning at Riverside City College
Riverside City College provides online programs for students who need flexibility.
6,699 undergraduate students at Riverside City College took at least one online class — of those, 6,808 took all of their classes online.
Distance education is available at the undergraduate level.
Business Programs at Riverside City College
The following business majors are available at Riverside City College, with the number of degrees awarded at each level in the most recent reporting year.
| Program | Bachelor’s | Master’s | Doctorate | Total |
|---|---|---|---|---|
| Business Administration, Management and Operations | — | — | — | 371 |
| Accounting and Related Services | — | — | — | 64 |
| Business/Commerce, General | — | — | — | 53 |
| Real Estate | — | — | — | 48 |
| Business Operations Support and Assistant Services | — | — | — | 25 |
| Business, Management, Marketing, and Related Support Services, Other | — | — | — | 15 |
| Entrepreneurial and Small Business Operations | — | — | — | 13 |
| General Sales, Merchandising and Related Marketing Operations | — | — | — | 11 |
| International Business | — | — | — | 3 |
Academic Programs at Riverside City College
Riverside City College offers 28 distinct academic programs.
The highest level of award offered is At least 2 but less than 4 academic years.
Institutional Profile
Riverside City College maintains an open admission policy: Yes. Credit transfer:
- AP credits: Yes
- Dual enrollment credits: Yes
- Life experience credits: Implied no
References
More about our data sources and methodologies.
Featured Schools

You have goals. Southern New Hampshire University can help you get there. Whether you need a bachelor's degree to get into a career or want a master's degree to move up in your current career, SNHU has an online program for you. Find your degree from over 200 online programs.
Visit SchoolBusinessDegreeCentral.com provides higher-education, college and university, degree, program, career, salary, and other helpful information to students, faculty, institutions, and other internet audiences. Presented information and data are subject to change. Inclusion on this website does not imply or represent a direct relationship with the company, school, or brand. Information, though believed correct at time of publication, may not be correct, and no warranty is provided. Contact the schools to verify any information before relying on it. Financial aid may be available for those who qualify. The displayed options may include sponsored or recommended results, not necessarily based on your preferences.
© BusinessDegreeCentral.com – All Rights Reserved.