Accounting at Belmont University
What traits are you looking for in a school for Accounting, you may want to check out the program at Belmont University. We’ve gathered the following information to help you decide.
Belmont University sits in Nashville, TN.
In the most recent year for which we have data, 37 accounting graduations were recorded at Belmont University.
Featured schools near , edit
Studying Online at Belmont University
Distance learning is available at Belmont University. Among 8,803 students, 141 (2%) studied exclusively online and 3,322 (38%) took at least some classes online.
Accounting Rankings at Belmont University
Use these rankings to compare Belmont University’s Accounting program against peer institutions.
Bachelor’s-Level Rankings
| Ranking | Scope | Rank |
|---|---|---|
| Best Schools (Quality) | Tennessee | #3 of 18 |
| Best Value | Tennessee | #18 of 18 |
| Best Schools (Quality) | Southeast (Region) | #24 of 265 |
| Best Schools (Quality) | Nationwide | #171 of 1,145 |
| Best Value | Southeast (Region) | #258 of 265 |
| Best Value | Nationwide | #1075 of 1,141 |
Master’s-Level Rankings
| Ranking | Scope | Rank |
|---|---|---|
| Best Schools (Quality) | Tennessee | #3 of 18 |
| Best Value | Tennessee | #18 of 18 |
| Best Schools (Quality) | Southeast (Region) | #24 of 265 |
| Best Schools (Quality) | Nationwide | #171 of 1,145 |
| Best Value | Southeast (Region) | #258 of 265 |
| Best Value | Nationwide | #1075 of 1,141 |
Earnings for Accounting Graduates from Belmont University
Those who finish Belmont University’s Accounting program earn the following amounts (per the U.S. Department of Education’s College Scorecard):

| Years After Graduation | Median Earnings |
|---|---|
| 1 year | $62,188 |
| 2 years | $59,967 |
| 3 years | $71,582 |
| 4 years | $77,799 |
| 5 years | $93,045 |
Is this above or below average for the school? Four years after graduating, Accounting graduates from Belmont University earn a median of $77,799, compared with $56,239 for all Belmont University graduates — about 38% higher than the school-wide median.

Student Demographics & Diversity
Below you’ll find the composition of Accounting graduates at Belmont University, broken down by degree level.
Looking at the program as a whole, Accounting graduates at Belmont University are 54% women (20) and 46% men (17).
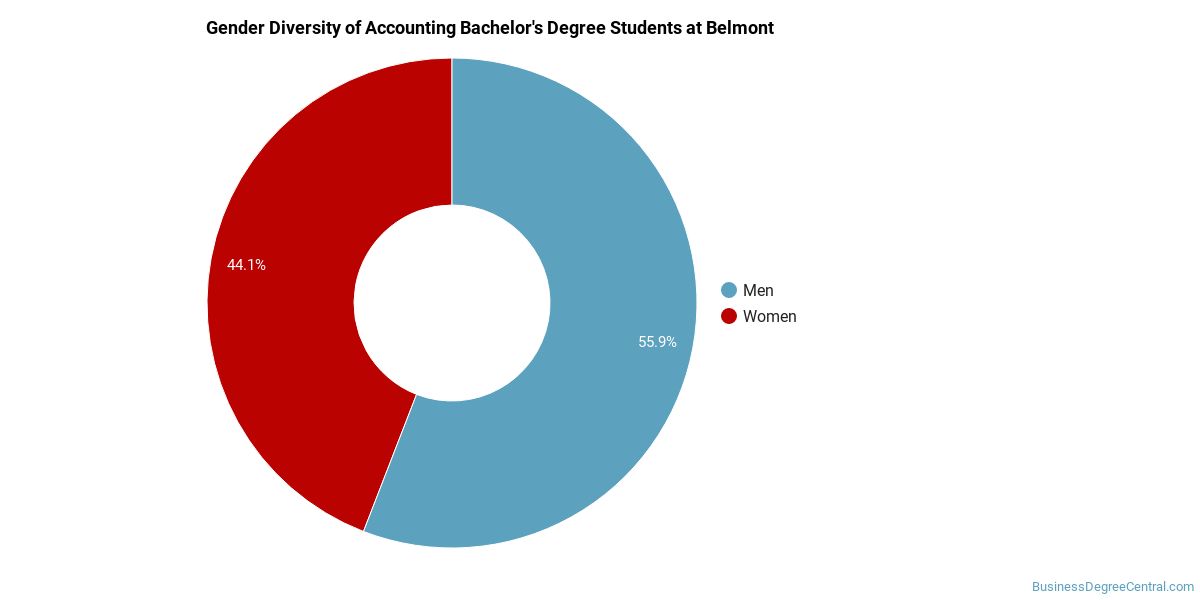
Accounting Bachelor’s Program at Belmont University
Among the 16 bachelor’s accounting degrees awarded at Belmont University, 56% were women (9) and 44% were men (7).
The following table and chart show the race/ethnicity of Accounting bachelor’s degree recipients at Belmont University.
| Race / Ethnicity | Number of Graduates |
|---|---|
| White | 12 |
| Hispanic / Latino | 1 |
| Asian | 3 |
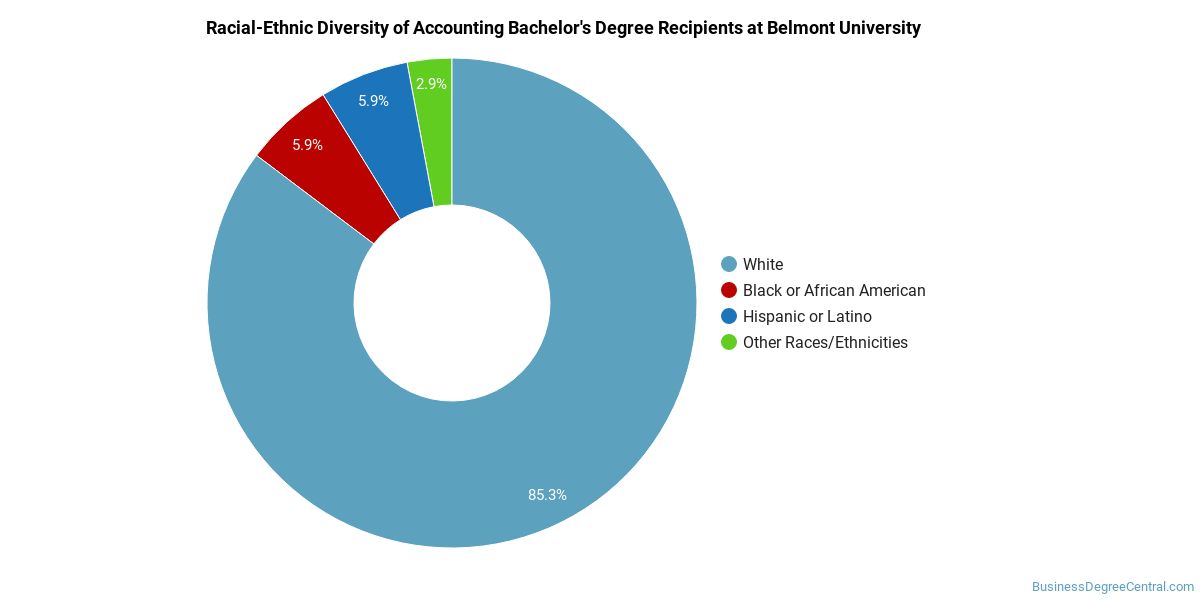
Racial-ethnic minorities make up 25% of Accounting bachelor’s degree recipients at Belmont University, lower than the national average of 35%.*
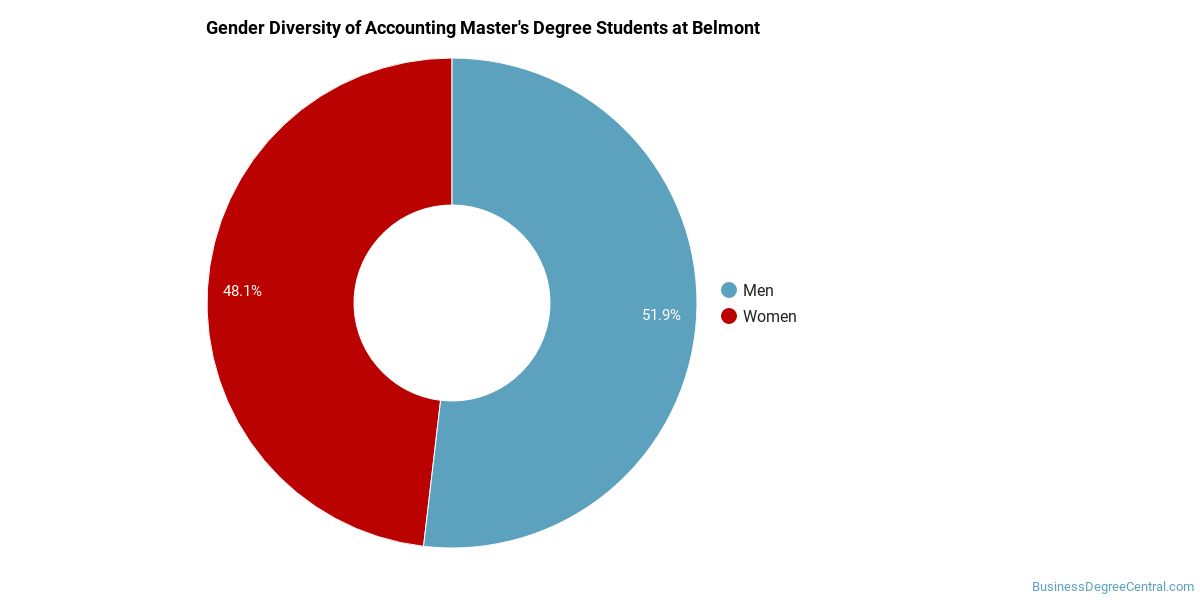
Accounting Master’s Program at Belmont University
Among the 21 master’s accounting degrees awarded at Belmont University, 52% were women (11) and 48% were men (10).
The following table and chart show the race/ethnicity of Accounting master’s degree recipients at Belmont University.
| Race / Ethnicity | Number of Graduates |
|---|---|
| White | 15 |
| Black / African American | 3 |
| Asian | 2 |
| International (Nonresident) | 1 |
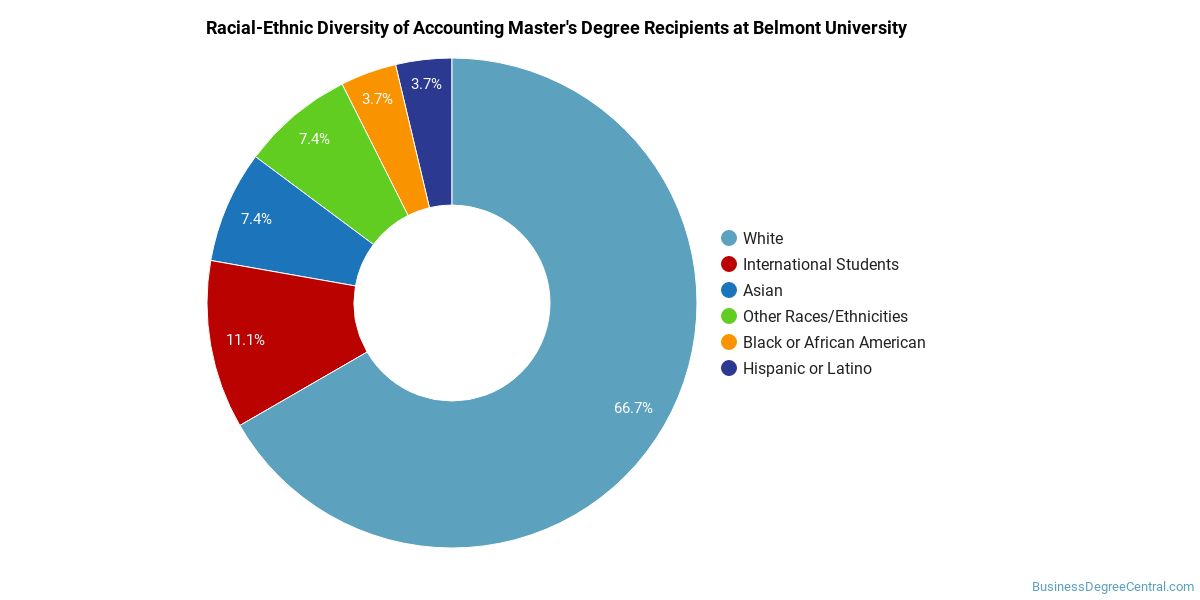
Racial-ethnic minorities make up 24% of Accounting master’s degree recipients at Belmont University, below the national average of 35%.*
*The racial-ethnic minorities figure is the total number of graduates minus White, international (nonresident), and unknown-race graduates.
More Specific Accounting Concentrations at Belmont University
This Accounting program at Belmont University breaks down into more specific concentrations:
| Concentration | Graduates |
|---|---|
| General Accounting | 37 |
Best-Paid Careers for Accounting Graduates
Graduates of the Accounting program at Belmont University go on to a range of careers. The table below ranks the best-paid careers for Accounting graduates, ordered by median annual salary:
| Occupation | Nationwide Median Wage |
|---|---|
| Treasurers and Controllers | $162,461 |
| Investment Fund Managers | $157,819 |
| Financial Risk Specialists | $127,364 |
| Appraisers of Personal and Business Property | $118,242 |
| Financial Examiners | $117,139 |
| Financial and Investment Analysts | $82,666 |
| Budget Analysts | $80,859 |
| Accountants and Auditors | $79,222 |
| Tax Examiners and Collectors, and Revenue Agents | $77,212 |
| Financial Managers | $75,665 |
References
- IPEDS — Integrated Postsecondary Education Data System
- U.S. Department of Education — College Scorecard
- O*NET Online (Bureau of Labor Statistics)
- National Center for Education Statistics
More about our data sources and methodologies.
BusinessDegreeCentral.com provides higher-education, college and university, degree, program, career, salary, and other helpful information to students, faculty, institutions, and other internet audiences. Presented information and data are subject to change. Inclusion on this website does not imply or represent a direct relationship with the company, school, or brand. Information, though believed correct at time of publication, may not be correct, and no warranty is provided. Contact the schools to verify any information before relying on it. Financial aid may be available for those who qualify. The displayed options may include sponsored or recommended results, not necessarily based on your preferences.
© BusinessDegreeCentral.com – All Rights Reserved.