Virginia Tech Business Programs
Virginia Tech is a public institution situated in Blacksburg, Virginia. The location of Virginia Tech is great for students who prefer living in an urban area.
Featured schools near , edit
Where Is Virginia Tech?

Contact details for Virginia Tech are given below.
| Contact Details | |
|---|---|
| Address: | 210 Burruss Hall, 800 Drillfield Dr., Blacksburg, VA 24061-0131 |
| Phone: | 540-231-6994 |
| Website: | www.vt.edu |
How Do I Get Into Virginia Tech?
You can apply to Virginia Tech online at: vt.edu/apply.html
Admission Requirements for Virginia Tech
| Submission | Required? |
|---|---|
| High School GPA | 1 |
| High School Rank | 3 |
| High School Transcript | 1 |
| College Prep Program | 5 |
| Recommendations | 3 |
| SAT or ACT Scores | 5 |
| TOEFL | 1 |
How Hard Is It To Get Into Virginia Tech?
Approximately 54% of accepted students are men and 46% are women. The acceptance rate for men is 52%, and the acceptance rate for women is 63%.
Average Test Scores
About 39% of students accepted to Virginia Tech submitted their SAT scores. When looking at the 25th through the 75th percentile, SAT Evidence-Based Reading and Writing scores ranged between 620 and 700. Math scores were between 620 and 730.
Can I Afford Virginia Tech?
The net price is calculated by adding tuition, room, board and other costs and subtracting financial aid.
Student Loan Debt
Almost 66% of college students who graduated with the class of 2018 took out student loans, but that percentage varies from school to school. At Virginia Tech, approximately 42% of students took out student loans averaging $9,600 a year. That adds up to $38,400 over four years for those students.
Virginia Tech Undergraduate Student Diversity
There are also 7,519 graduate students at the school.
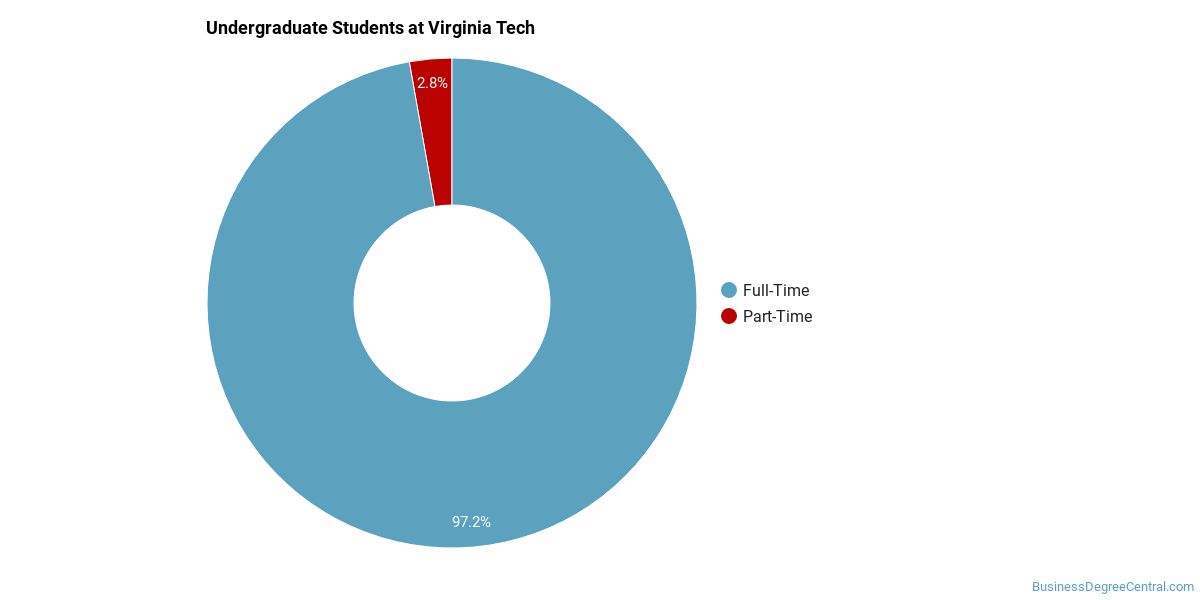
Gender Diversity
Of the 28,929 full-time undergraduates at Virginia Tech, 57% are male and 43% are female.

Racial-Ethnic Diversity
The racial-ethnic breakdown of Virginia Tech students is as follows.
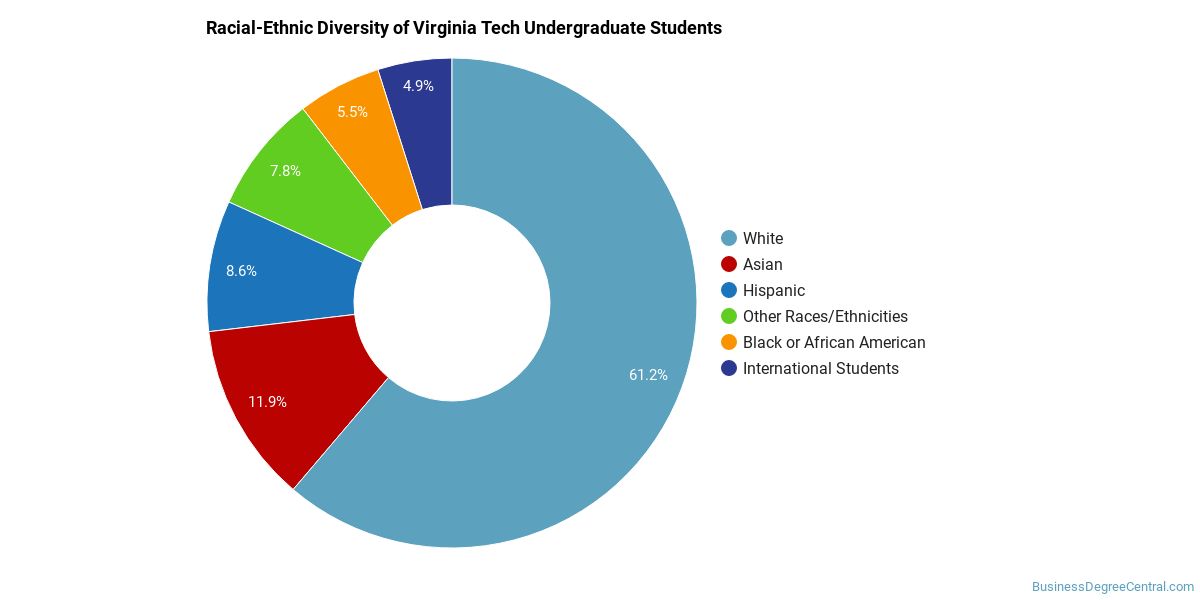
| Race/Ethnicity | Number of Grads |
|---|---|
| Asian | 3,444 |
| Black or African American | 1,597 |
| Hispanic or Latino | 2,498 |
| White | 17,712 |
| International Students | 1,417 |
| Other Races/Ethnicities | 2,261 |
Geographic Diversity
Virginia students aren't the only ones who study at Virginia Tech. At this time, 42 states are represented by the student population at the school.
Over 115 countries are represented at Virginia Tech. The most popular countries sending students to the school are China, India, and South Korea.
Online Learning at Virginia Tech
The following chart shows how the online learning population at Virginia Tech has changed over the last few years.

This school is the 10th most popular in Virginia for online learning according to the online graduations recorded by the Department of Education for the academic year 2022-2023.
Virginia Tech Business Concentrations
The table below shows the number of awards for each concentration.
| Major | Bachelor’s | Graduate Certificate | Master’s | Doctor’s | TOTAL |
|---|---|---|---|---|---|
| Management Science | 444 | 0 | 0 | 0 | 444 |
| Finance | 294 | 0 | 0 | 0 | 294 |
| General Business Administration and Management | 165 | 0 | 120 | 0 | 285 |
| Accounting | 162 | 0 | 68 | 0 | 230 |
| Marketing/Marketing Management, General | 211 | 0 | 0 | 0 | 211 |
| Real Estate | 112 | 0 | 0 | 0 | 112 |
| Construction Management | 101 | 0 | 9 | 0 | 110 |
| General Economics | 60 | 0 | 5 | 0 | 65 |
| General Hospitality Administration/Management | 54 | 0 | 0 | 0 | 54 |
| Interior Design Management | 0 | 35 | 0 | 0 | 35 |
| Agribusiness/Agricultural Business Operations | 31 | 0 | 0 | 0 | 31 |
| Information Resources Management | 0 | 21 | 0 | 0 | 21 |
| Applied Economics | 19 | 0 | 0 | 0 | 19 |
| General Business/Commerce | 0 | 0 | 0 | 11 | 11 |
| Econometrics & Quantitative Economics | 0 | 0 | 0 | 10 | 10 |
| Agricultural Economics | 0 | 0 | 8 | 0 | 8 |
| Development Economics & International Development | 0 | 3 | 0 | 0 | 3 |
| Non-Profit/Public/Organizational Management | 0 | 1 | 0 | 0 | 1 |
| Public Finance | 0 | 1 | 0 | 0 | 1 |
| Business Economics | 0 | 0 | 0 | 0 | 0 |
| TOTAL | 1,653 | 61 | 210 | 21 | 1,945 |
References
*The racial-ethnic minorities count is calculated by taking the total number of students and subtracting white students, international students, and students whose race/ethnicity was unknown. This number is then divided by the total number of students at the school to obtain the racial-ethnic minorities percentage.
- College Factual
- National Center for Education Statistics
- Image Credit: By Eric T Gunther under License
More about our data sources and methodologies.
Featured Schools

You have goals. Southern New Hampshire University can help you get there. Whether you need a bachelor's degree to get into a career or want a master's degree to move up in your current career, SNHU has an online program for you. Find your degree from over 200 online programs.
Visit SchoolBusinessDegreeCentral.com provides higher-education, college and university, degree, program, career, salary, and other helpful information to students, faculty, institutions, and other internet audiences. Presented information and data are subject to change. Inclusion on this website does not imply or represent a direct relationship with the company, school, or brand. Information, though believed correct at time of publication, may not be correct, and no warranty is provided. Contact the schools to verify any information before relying on it. Financial aid may be available for those who qualify. The displayed options may include sponsored or recommended results, not necessarily based on your preferences.
© BusinessDegreeCentral.com – All Rights Reserved.